

13 Morphological Modelling and Simulation …
455
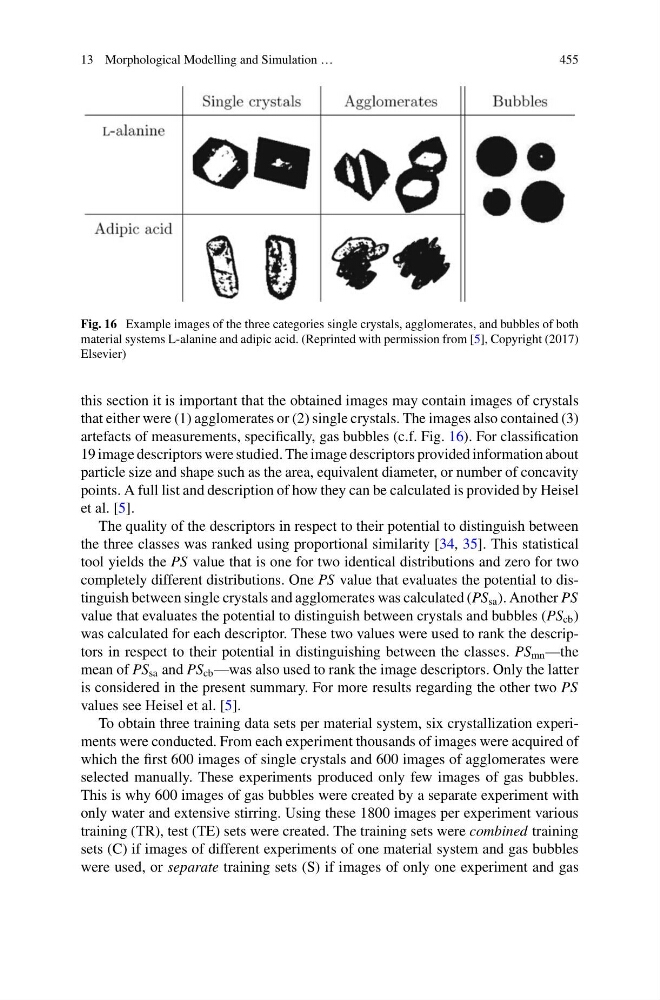
Fig. 16 Example images of the three categories single crystals, agglomerates, and bubbles of both
material systems L-alanine and adipic acid. (Reprinted with permission from [5], Copyright (2017)
Elsevier)
this section it is important that the obtained images may contain images of crystals
that either were (1) agglomerates or (2) single crystals. The images also contained (3)
artefacts of measurements, specifically, gas bubbles (c.f. Fig. 16). For classification
19 image descriptors were studied. The image descriptors provided information about
particle size and shape such as the area, equivalent diameter, or number of concavity
points. A full list and description of how they can be calculated is provided by Heisel
et al. [5].
The quality of the descriptors in respect to their potential to distinguish between
the three classes was ranked using proportional similarity [34, 35]. This statistical
tool yields the PS value that is one for two identical distributions and zero for two
completely different distributions. One PS value that evaluates the potential to distinguish between single crystals and agglomerates was calculated (PS sa ). Another PS
value that evaluates the potential to distinguish between crystals and bubbles (PS cb )
was calculated for each descriptor. These two values were used to rank the descriptors in respect to their potential in distinguishing between the classes. PS mn —the
mean of PS sa and PS cb —was also used to rank the image descriptors. Only the latter
is considered in the present summary. For more results regarding the other two PS
values see Heisel et al. [5].
To obtain three training data sets per material system, six crystallization experiments were conducted. From each experiment thousands of images were acquired of
which the first 600 images of single crystals and 600 images of agglomerates were
selected manually. These experiments produced only few images of gas bubbles.
This is why 600 images of gas bubbles were created by a separate experiment with
only water and extensive stirring. Using these 1800 images per experiment various
training (TR), test (TE) sets were created. The training sets were combined training
sets (C) if images of different experiments of one material system and gas bubbles
were used, or separate training sets (S) if images of only one experiment and gas
455
Fig. 16 Example images of the three categories single crystals, agglomerates, and bubbles of both
material systems L-alanine and adipic acid. (Reprinted with permission from [5], Copyright (2017)
Elsevier)
this section it is important that the obtained images may contain images of crystals
that either were (1) agglomerates or (2) single crystals. The images also contained (3)
artefacts of measurements, specifically, gas bubbles (c.f. Fig. 16). For classification
19 image descriptors were studied. The image descriptors provided information about
particle size and shape such as the area, equivalent diameter, or number of concavity
points. A full list and description of how they can be calculated is provided by Heisel
et al. [5].
The quality of the descriptors in respect to their potential to distinguish between
the three classes was ranked using proportional similarity [34, 35]. This statistical
tool yields the PS value that is one for two identical distributions and zero for two
completely different distributions. One PS value that evaluates the potential to distinguish between single crystals and agglomerates was calculated (PS sa ). Another PS
value that evaluates the potential to distinguish between crystals and bubbles (PS cb )
was calculated for each descriptor. These two values were used to rank the descriptors in respect to their potential in distinguishing between the classes. PS mn —the
mean of PS sa and PS cb —was also used to rank the image descriptors. Only the latter
is considered in the present summary. For more results regarding the other two PS
values see Heisel et al. [5].
To obtain three training data sets per material system, six crystallization experiments were conducted. From each experiment thousands of images were acquired of
which the first 600 images of single crystals and 600 images of agglomerates were
selected manually. These experiments produced only few images of gas bubbles.
This is why 600 images of gas bubbles were created by a separate experiment with
only water and extensive stirring. Using these 1800 images per experiment various
training (TR), test (TE) sets were created. The training sets were combined training
sets (C) if images of different experiments of one material system and gas bubbles
were used, or separate training sets (S) if images of only one experiment and gas