

13 Morphological Modelling and Simulation …
441
of a projection. In other words, these lines represent long sections of the outline. The
corresponding distance ρ l and normal vector
cos ϕ j , sin ϕ j
T were hence potential
values for an H-representation.
To reduce the number of outlines, only local maximum bin values (index m) were
considered as detected lines. They were described by the vectors
a c,Π p ,m = (cos ϕ m , sin ϕ m )
T
(13)
that make up the matrix A of a 2D H–representation. The face distances h were given
by all ρ m . Like this, a 2D H–representation of a projection was found.
To describe not only the kernel crystal but also the roundness, a disc with radius λ r
was added to the H-representation using the Minkowski addition. The size of this disc
was determined by solving a minimization problem: The experimental data contained
the outline of a projection. This outline was also described by the Minkowski addition
of the previously found H–representation and a disk of unknown radius λ r (Eq. 5).
An appropriate disc radius was then found by minimizing the distance between these
two lines. A detailed description is given by Reinhold and Briesen [9].
From the Minkowski additions of each projection Π p , a mean width μ
mw
Π p
was
obtained according to Eq. (8) and used to calculate the additive roundness defined in
Eq. (11).
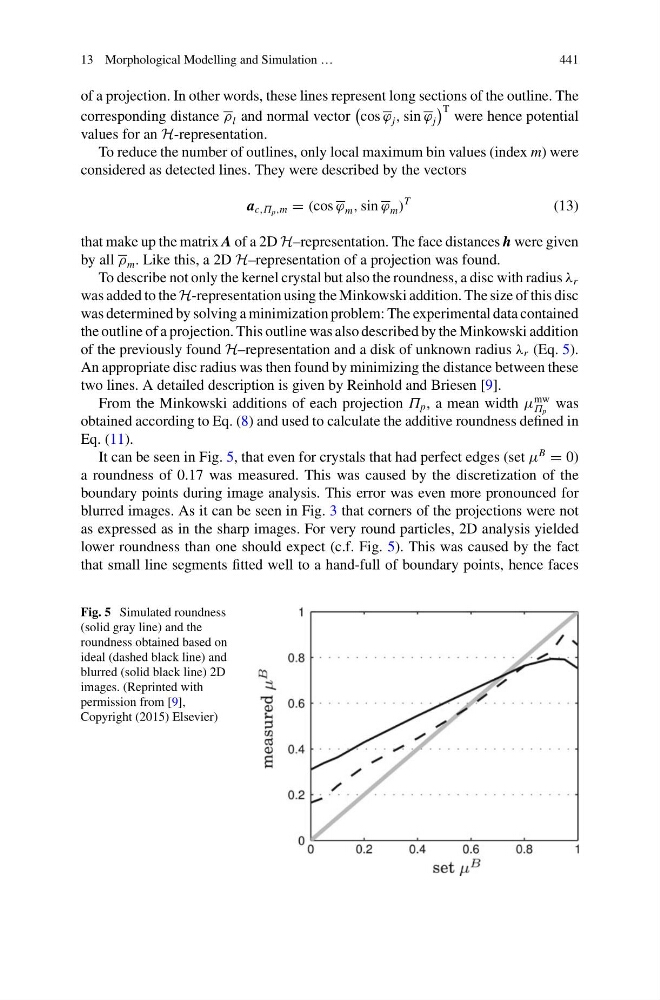
It can be seen in Fig. 5, that even for crystals that had perfect edges (set μ
B
= 0)
a roundness of 0.17 was measured. This was caused by the discretization of the
boundary points during image analysis. This error was even more pronounced for
blurred images. As it can be seen in Fig. 3 that corners of the projections were not
as expressed as in the sharp images. For very round particles, 2D analysis yielded
lower roundness than one should expect (c.f. Fig. 5). This was caused by the fact
that small line segments fitted well to a hand-full of boundary points, hence faces
Fig. 5 Simulated roundness
(solid gray line) and the
roundness obtained based on
ideal (dashed black line) and
blurred (solid black line) 2D
images. (Reprinted with
permission from [9],
Copyright (2015) Elsevier)
441
of a projection. In other words, these lines represent long sections of the outline. The
corresponding distance ρ l and normal vector
cos ϕ j , sin ϕ j
T were hence potential
values for an H-representation.
To reduce the number of outlines, only local maximum bin values (index m) were
considered as detected lines. They were described by the vectors
a c,Π p ,m = (cos ϕ m , sin ϕ m )
T
(13)
that make up the matrix A of a 2D H–representation. The face distances h were given
by all ρ m . Like this, a 2D H–representation of a projection was found.
To describe not only the kernel crystal but also the roundness, a disc with radius λ r
was added to the H-representation using the Minkowski addition. The size of this disc
was determined by solving a minimization problem: The experimental data contained
the outline of a projection. This outline was also described by the Minkowski addition
of the previously found H–representation and a disk of unknown radius λ r (Eq. 5).
An appropriate disc radius was then found by minimizing the distance between these
two lines. A detailed description is given by Reinhold and Briesen [9].
From the Minkowski additions of each projection Π p , a mean width μ
mw
Π p
was
obtained according to Eq. (8) and used to calculate the additive roundness defined in
Eq. (11).
It can be seen in Fig. 5, that even for crystals that had perfect edges (set μ
B
= 0)
a roundness of 0.17 was measured. This was caused by the discretization of the
boundary points during image analysis. This error was even more pronounced for
blurred images. As it can be seen in Fig. 3 that corners of the projections were not
as expressed as in the sharp images. For very round particles, 2D analysis yielded
lower roundness than one should expect (c.f. Fig. 5). This was caused by the fact
that small line segments fitted well to a hand-full of boundary points, hence faces
Fig. 5 Simulated roundness
(solid gray line) and the
roundness obtained based on
ideal (dashed black line) and
blurred (solid black line) 2D
images. (Reprinted with
permission from [9],
Copyright (2015) Elsevier)