

398
E. Lukas et al.
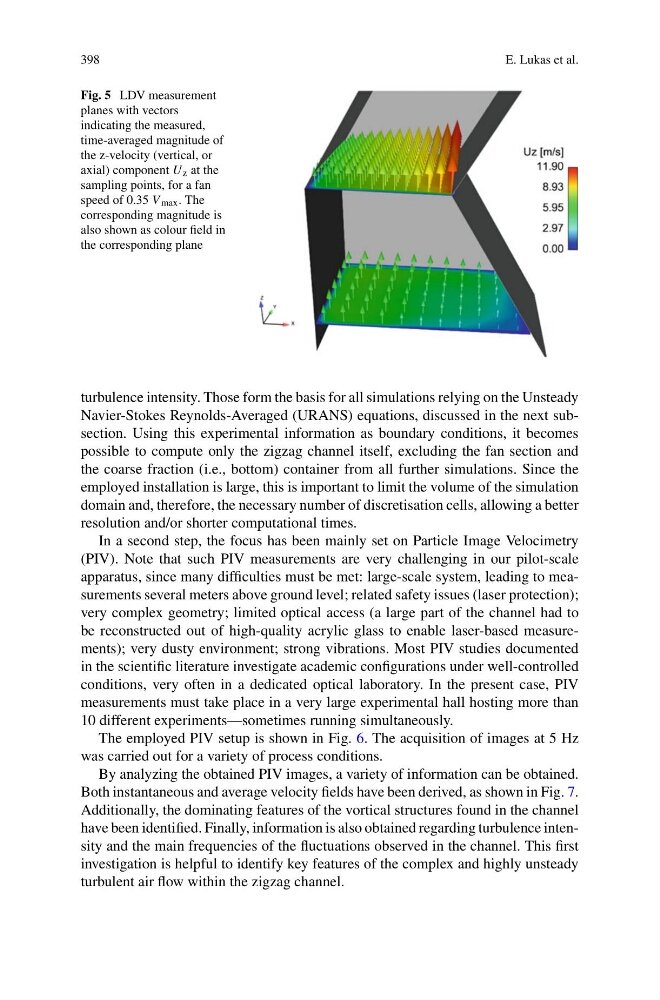
Fig. 5 LDV measurement
planes with vectors
indicating the measured,
time-averaged magnitude of
the z-velocity (vertical, or
axial) component U z at the
sampling points, for a fan
speed of 0.35 V max . The
corresponding magnitude is
also shown as colour field in
the corresponding plane
turbulence intensity. Those form the basis for all simulations relying on the Unsteady
Navier-Stokes Reynolds-Averaged (URANS) equations, discussed in the next subsection. Using this experimental information as boundary conditions, it becomes
possible to compute only the zigzag channel itself, excluding the fan section and
the coarse fraction (i.e., bottom) container from all further simulations. Since the
employed installation is large, this is important to limit the volume of the simulation
domain and, therefore, the necessary number of discretisation cells, allowing a better
resolution and/or shorter computational times.
In a second step, the focus has been mainly set on Particle Image Velocimetry
(PIV). Note that such PIV measurements are very challenging in our pilot-scale
apparatus, since many difficulties must be met: large-scale system, leading to measurements several meters above ground level; related safety issues (laser protection);
very complex geometry; limited optical access (a large part of the channel had to
be reconstructed out of high-quality acrylic glass to enable laser-based measurements); very dusty environment; strong vibrations. Most PIV studies documented
in the scientific literature investigate academic configurations under well-controlled
conditions, very often in a dedicated optical laboratory. In the present case, PIV
measurements must take place in a very large experimental hall hosting more than
10 different experiments—sometimes running simultaneously.
The employed PIV setup is shown in Fig. 6. The acquisition of images at 5 Hz
was carried out for a variety of process conditions.
By analyzing the obtained PIV images, a variety of information can be obtained.
Both instantaneous and average velocity fields have been derived, as shown in Fig. 7.
Additionally, the dominating features of the vortical structures found in the channel
have been identified. Finally, information is also obtained regarding turbulence intensity and the main frequencies of the fluctuations observed in the channel. This first
investigation is helpful to identify key features of the complex and highly unsteady
turbulent air flow within the zigzag channel.
E. Lukas et al.
Fig. 5 LDV measurement
planes with vectors
indicating the measured,
time-averaged magnitude of
the z-velocity (vertical, or
axial) component U z at the
sampling points, for a fan
speed of 0.35 V max . The
corresponding magnitude is
also shown as colour field in
the corresponding plane
turbulence intensity. Those form the basis for all simulations relying on the Unsteady
Navier-Stokes Reynolds-Averaged (URANS) equations, discussed in the next subsection. Using this experimental information as boundary conditions, it becomes
possible to compute only the zigzag channel itself, excluding the fan section and
the coarse fraction (i.e., bottom) container from all further simulations. Since the
employed installation is large, this is important to limit the volume of the simulation
domain and, therefore, the necessary number of discretisation cells, allowing a better
resolution and/or shorter computational times.
In a second step, the focus has been mainly set on Particle Image Velocimetry
(PIV). Note that such PIV measurements are very challenging in our pilot-scale
apparatus, since many difficulties must be met: large-scale system, leading to measurements several meters above ground level; related safety issues (laser protection);
very complex geometry; limited optical access (a large part of the channel had to
be reconstructed out of high-quality acrylic glass to enable laser-based measurements); very dusty environment; strong vibrations. Most PIV studies documented
in the scientific literature investigate academic configurations under well-controlled
conditions, very often in a dedicated optical laboratory. In the present case, PIV
measurements must take place in a very large experimental hall hosting more than
10 different experiments—sometimes running simultaneously.
The employed PIV setup is shown in Fig. 6. The acquisition of images at 5 Hz
was carried out for a variety of process conditions.
By analyzing the obtained PIV images, a variety of information can be obtained.
Both instantaneous and average velocity fields have been derived, as shown in Fig. 7.
Additionally, the dominating features of the vortical structures found in the channel
have been identified. Finally, information is also obtained regarding turbulence intensity and the main frequencies of the fluctuations observed in the channel. This first
investigation is helpful to identify key features of the complex and highly unsteady
turbulent air flow within the zigzag channel.