

10 Dynamics of Separation Characteristics of Sieving and Flow …
373
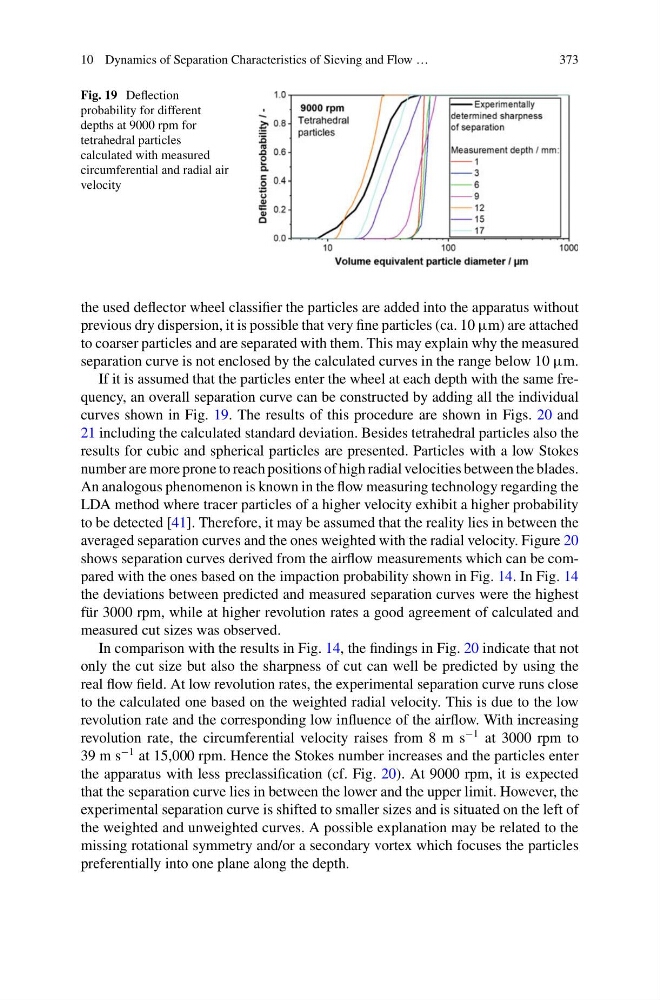
Fig. 19 Deflection
probability for different
depths at 9000 rpm for
tetrahedral particles
calculated with measured
circumferential and radial air
velocity
the used deflector wheel classifier the particles are added into the apparatus without
previous dry dispersion, it is possible that very fine particles (ca. 10 μm) are attached
to coarser particles and are separated with them. This may explain why the measured
separation curve is not enclosed by the calculated curves in the range below 10 μm.
If it is assumed that the particles enter the wheel at each depth with the same frequency, an overall separation curve can be constructed by adding all the individual
curves shown in Fig. 19. The results of this procedure are shown in Figs. 20 and
21 including the calculated standard deviation. Besides tetrahedral particles also the
results for cubic and spherical particles are presented. Particles with a low Stokes
number are more prone to reach positions of high radial velocities between the blades.
An analogous phenomenon is known in the flow measuring technology regarding the
LDA method where tracer particles of a higher velocity exhibit a higher probability
to be detected [41]. Therefore, it may be assumed that the reality lies in between the
averaged separation curves and the ones weighted with the radial velocity. Figure 20
shows separation curves derived from the airflow measurements which can be compared with the ones based on the impaction probability shown in Fig. 14. In Fig. 14
the deviations between predicted and measured separation curves were the highest
für 3000 rpm, while at higher revolution rates a good agreement of calculated and
measured cut sizes was observed.
In comparison with the results in Fig. 14, the findings in Fig. 20 indicate that not
only the cut size but also the sharpness of cut can well be predicted by using the
real flow field. At low revolution rates, the experimental separation curve runs close
to the calculated one based on the weighted radial velocity. This is due to the low
revolution rate and the corresponding low influence of the airflow. With increasing
revolution rate, the circumferential velocity raises from 8 m s
−1 at 3000 rpm to
39 m s
−1 at 15,000 rpm. Hence the Stokes number increases and the particles enter
the apparatus with less preclassification (cf. Fig. 20). At 9000 rpm, it is expected
that the separation curve lies in between the lower and the upper limit. However, the
experimental separation curve is shifted to smaller sizes and is situated on the left of
the weighted and unweighted curves. A possible explanation may be related to the
missing rotational symmetry and/or a secondary vortex which focuses the particles
preferentially into one plane along the depth.
373
Fig. 19 Deflection
probability for different
depths at 9000 rpm for
tetrahedral particles
calculated with measured
circumferential and radial air
velocity
the used deflector wheel classifier the particles are added into the apparatus without
previous dry dispersion, it is possible that very fine particles (ca. 10 μm) are attached
to coarser particles and are separated with them. This may explain why the measured
separation curve is not enclosed by the calculated curves in the range below 10 μm.
If it is assumed that the particles enter the wheel at each depth with the same frequency, an overall separation curve can be constructed by adding all the individual
curves shown in Fig. 19. The results of this procedure are shown in Figs. 20 and
21 including the calculated standard deviation. Besides tetrahedral particles also the
results for cubic and spherical particles are presented. Particles with a low Stokes
number are more prone to reach positions of high radial velocities between the blades.
An analogous phenomenon is known in the flow measuring technology regarding the
LDA method where tracer particles of a higher velocity exhibit a higher probability
to be detected [41]. Therefore, it may be assumed that the reality lies in between the
averaged separation curves and the ones weighted with the radial velocity. Figure 20
shows separation curves derived from the airflow measurements which can be compared with the ones based on the impaction probability shown in Fig. 14. In Fig. 14
the deviations between predicted and measured separation curves were the highest
für 3000 rpm, while at higher revolution rates a good agreement of calculated and
measured cut sizes was observed.
In comparison with the results in Fig. 14, the findings in Fig. 20 indicate that not
only the cut size but also the sharpness of cut can well be predicted by using the
real flow field. At low revolution rates, the experimental separation curve runs close
to the calculated one based on the weighted radial velocity. This is due to the low
revolution rate and the corresponding low influence of the airflow. With increasing
revolution rate, the circumferential velocity raises from 8 m s
−1 at 3000 rpm to
39 m s
−1 at 15,000 rpm. Hence the Stokes number increases and the particles enter
the apparatus with less preclassification (cf. Fig. 20). At 9000 rpm, it is expected
that the separation curve lies in between the lower and the upper limit. However, the
experimental separation curve is shifted to smaller sizes and is situated on the left of
the weighted and unweighted curves. A possible explanation may be related to the
missing rotational symmetry and/or a secondary vortex which focuses the particles
preferentially into one plane along the depth.