

372
M. Weers et al.
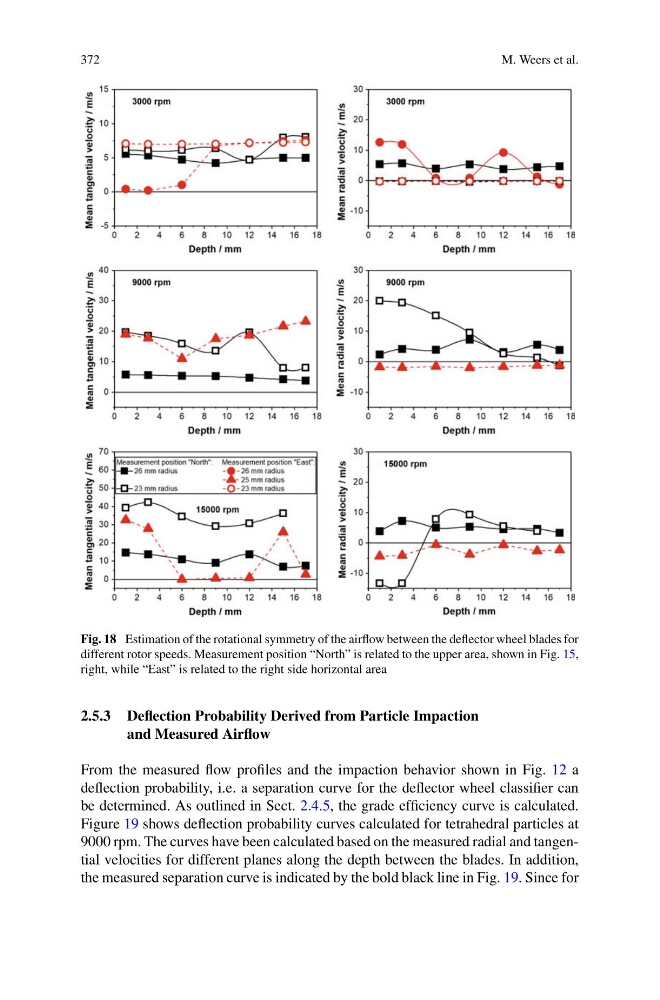
Fig. 18 Estimation of the rotational symmetry of the airflow between the deflector wheel blades for
different rotor speeds. Measurement position “North” is related to the upper area, shown in Fig. 15,
right, while “East” is related to the right side horizontal area
2.5.3 Deflection Probability Derived from Particle Impaction
and Measured Airflow
From the measured flow profiles and the impaction behavior shown in Fig. 12 a
deflection probability, i.e. a separation curve for the deflector wheel classifier can
be determined. As outlined in Sect. 2.4.5, the grade efficiency curve is calculated.
Figure 19 shows deflection probability curves calculated for tetrahedral particles at
9000 rpm. The curves have been calculated based on the measured radial and tangential velocities for different planes along the depth between the blades. In addition,
the measured separation curve is indicated by the bold black line in Fig. 19. Since for
M. Weers et al.
Fig. 18 Estimation of the rotational symmetry of the airflow between the deflector wheel blades for
different rotor speeds. Measurement position “North” is related to the upper area, shown in Fig. 15,
right, while “East” is related to the right side horizontal area
2.5.3 Deflection Probability Derived from Particle Impaction
and Measured Airflow
From the measured flow profiles and the impaction behavior shown in Fig. 12 a
deflection probability, i.e. a separation curve for the deflector wheel classifier can
be determined. As outlined in Sect. 2.4.5, the grade efficiency curve is calculated.
Figure 19 shows deflection probability curves calculated for tetrahedral particles at
9000 rpm. The curves have been calculated based on the measured radial and tangential velocities for different planes along the depth between the blades. In addition,
the measured separation curve is indicated by the bold black line in Fig. 19. Since for