

368
M. Weers et al.
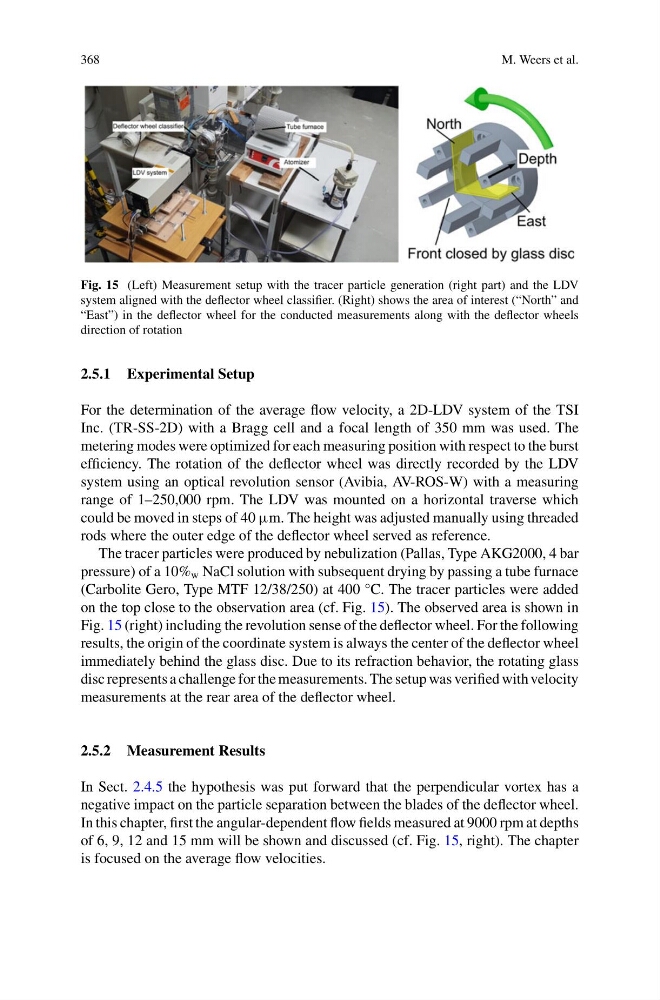
Fig. 15 (Left) Measurement setup with the tracer particle generation (right part) and the LDV
system aligned with the deflector wheel classifier. (Right) shows the area of interest (“North” and
“East”) in the deflector wheel for the conducted measurements along with the deflector wheels
direction of rotation
2.5.1 Experimental Setup
For the determination of the average flow velocity, a 2D-LDV system of the TSI
Inc. (TR-SS-2D) with a Bragg cell and a focal length of 350 mm was used. The
metering modes were optimized for each measuring position with respect to the burst
efficiency. The rotation of the deflector wheel was directly recorded by the LDV
system using an optical revolution sensor (Avibia, AV-ROS-W) with a measuring
range of 1–250,000 rpm. The LDV was mounted on a horizontal traverse which
could be moved in steps of 40 μm. The height was adjusted manually using threaded
rods where the outer edge of the deflector wheel served as reference.
The tracer particles were produced by nebulization (Pallas, Type AKG2000, 4 bar
pressure) of a 10% w NaCl solution with subsequent drying by passing a tube furnace
(Carbolite Gero, Type MTF 12/38/250) at 400 °C. The tracer particles were added
on the top close to the observation area (cf. Fig. 15). The observed area is shown in
Fig. 15 (right) including the revolution sense of the deflector wheel. For the following
results, the origin of the coordinate system is always the center of the deflector wheel
immediately behind the glass disc. Due to its refraction behavior, the rotating glass
disc represents a challenge for the measurements. The setup was verified with velocity
measurements at the rear area of the deflector wheel.
2.5.2 Measurement Results
In Sect. 2.4.5 the hypothesis was put forward that the perpendicular vortex has a
negative impact on the particle separation between the blades of the deflector wheel.
In this chapter, first the angular-dependent flow fields measured at 9000 rpm at depths
of 6, 9, 12 and 15 mm will be shown and discussed (cf. Fig. 15, right). The chapter
is focused on the average flow velocities.
M. Weers et al.
Fig. 15 (Left) Measurement setup with the tracer particle generation (right part) and the LDV
system aligned with the deflector wheel classifier. (Right) shows the area of interest (“North” and
“East”) in the deflector wheel for the conducted measurements along with the deflector wheels
direction of rotation
2.5.1 Experimental Setup
For the determination of the average flow velocity, a 2D-LDV system of the TSI
Inc. (TR-SS-2D) with a Bragg cell and a focal length of 350 mm was used. The
metering modes were optimized for each measuring position with respect to the burst
efficiency. The rotation of the deflector wheel was directly recorded by the LDV
system using an optical revolution sensor (Avibia, AV-ROS-W) with a measuring
range of 1–250,000 rpm. The LDV was mounted on a horizontal traverse which
could be moved in steps of 40 μm. The height was adjusted manually using threaded
rods where the outer edge of the deflector wheel served as reference.
The tracer particles were produced by nebulization (Pallas, Type AKG2000, 4 bar
pressure) of a 10% w NaCl solution with subsequent drying by passing a tube furnace
(Carbolite Gero, Type MTF 12/38/250) at 400 °C. The tracer particles were added
on the top close to the observation area (cf. Fig. 15). The observed area is shown in
Fig. 15 (right) including the revolution sense of the deflector wheel. For the following
results, the origin of the coordinate system is always the center of the deflector wheel
immediately behind the glass disc. Due to its refraction behavior, the rotating glass
disc represents a challenge for the measurements. The setup was verified with velocity
measurements at the rear area of the deflector wheel.
2.5.2 Measurement Results
In Sect. 2.4.5 the hypothesis was put forward that the perpendicular vortex has a
negative impact on the particle separation between the blades of the deflector wheel.
In this chapter, first the angular-dependent flow fields measured at 9000 rpm at depths
of 6, 9, 12 and 15 mm will be shown and discussed (cf. Fig. 15, right). The chapter
is focused on the average flow velocities.