

10 Dynamics of Separation Characteristics of Sieving and Flow …
357
2.4.1 Estimation of the COR with the Model of Thornton and Ning
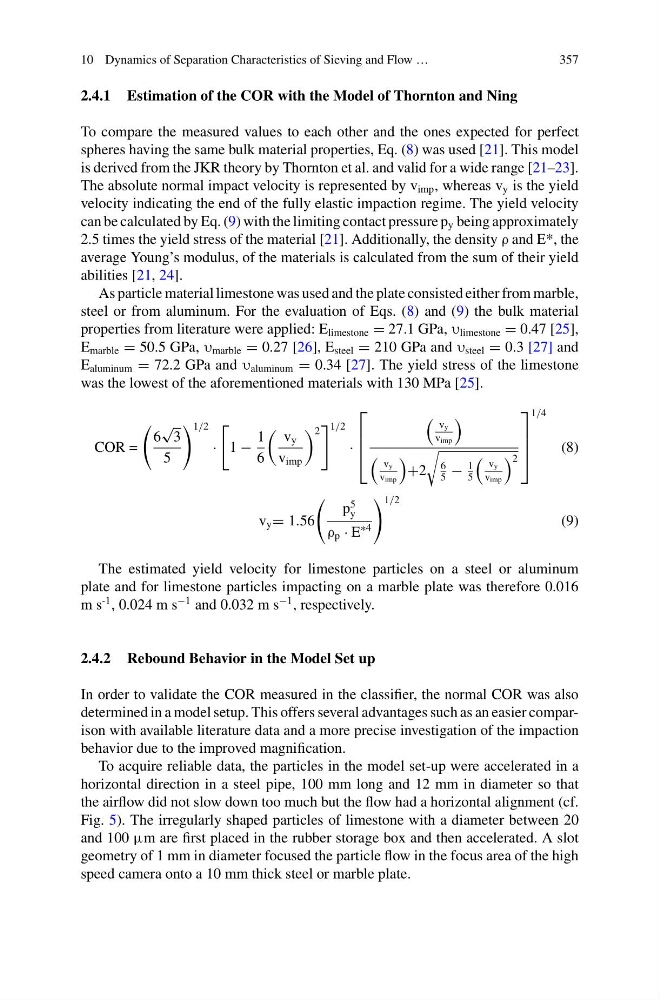
To compare the measured values to each other and the ones expected for perfect
spheres having the same bulk material properties, Eq. (8) was used [21]. This model
is derived from the JKR theory by Thornton et al. and valid for a wide range [21–23].
The absolute normal impact velocity is represented by v imp , whereas v y is the yield
velocity indicating the end of the fully elastic impaction regime. The yield velocity
can be calculated by Eq. (9) with the limiting contact pressure p y being approximately
2.5 times the yield stress of the material [21]. Additionally, the density ρ and E*, the
average Young’s modulus, of the materials is calculated from the sum of their yield
abilities [21, 24].
As particle material limestone was used and the plate consisted either from marble,
steel or from aluminum. For the evaluation of Eqs. (8) and (9) the bulk material
properties from literature were applied: E limestone = 27.1 GPa, υ limestone = 0.47 [25],
E marble = 50.5 GPa, υ marble = 0.27 [26], E steel = 210 GPa and υ steel = 0.3 [27] and
E aluminum = 72.2 GPa and υ aluminum = 0.34 [27]. The yield stress of the limestone
was the lowest of the aforementioned materials with 130 MPa [25].
COR =
6
√
3
5
1/2
·
1 −
1
6
v y
v imp
2
1/2
·
⎡
⎢
⎢
⎣
v y
v imp
v y
v imp
+2
6
5
−
1
5
v y
v imp
2
⎤
⎥
⎥
⎦
1/4
(8)
v y = 1.56
p
5
y
ρ p · E
∗4
1/2
(9)
The estimated yield velocity for limestone particles on a steel or aluminum
plate and for limestone particles impacting on a marble plate was therefore 0.016
m s
-1 , 0.024 m s
−1 and 0.032 m s
−1 , respectively.
2.4.2 Rebound Behavior in the Model Set up
In order to validate the COR measured in the classifier, the normal COR was also
determined in a model setup. This offers several advantages such as an easier comparison with available literature data and a more precise investigation of the impaction
behavior due to the improved magnification.
To acquire reliable data, the particles in the model set-up were accelerated in a
horizontal direction in a steel pipe, 100 mm long and 12 mm in diameter so that
the airflow did not slow down too much but the flow had a horizontal alignment (cf.
Fig. 5). The irregularly shaped particles of limestone with a diameter between 20
and 100 μm are first placed in the rubber storage box and then accelerated. A slot
geometry of 1 mm in diameter focused the particle flow in the focus area of the high
speed camera onto a 10 mm thick steel or marble plate.
357
2.4.1 Estimation of the COR with the Model of Thornton and Ning
To compare the measured values to each other and the ones expected for perfect
spheres having the same bulk material properties, Eq. (8) was used [21]. This model
is derived from the JKR theory by Thornton et al. and valid for a wide range [21–23].
The absolute normal impact velocity is represented by v imp , whereas v y is the yield
velocity indicating the end of the fully elastic impaction regime. The yield velocity
can be calculated by Eq. (9) with the limiting contact pressure p y being approximately
2.5 times the yield stress of the material [21]. Additionally, the density ρ and E*, the
average Young’s modulus, of the materials is calculated from the sum of their yield
abilities [21, 24].
As particle material limestone was used and the plate consisted either from marble,
steel or from aluminum. For the evaluation of Eqs. (8) and (9) the bulk material
properties from literature were applied: E limestone = 27.1 GPa, υ limestone = 0.47 [25],
E marble = 50.5 GPa, υ marble = 0.27 [26], E steel = 210 GPa and υ steel = 0.3 [27] and
E aluminum = 72.2 GPa and υ aluminum = 0.34 [27]. The yield stress of the limestone
was the lowest of the aforementioned materials with 130 MPa [25].
COR =
6
√
3
5
1/2
·
1 −
1
6
v y
v imp
2
1/2
·
⎡
⎢
⎢
⎣
v y
v imp
v y
v imp
+2
6
5
−
1
5
v y
v imp
2
⎤
⎥
⎥
⎦
1/4
(8)
v y = 1.56
p
5
y
ρ p · E
∗4
1/2
(9)
The estimated yield velocity for limestone particles on a steel or aluminum
plate and for limestone particles impacting on a marble plate was therefore 0.016
m s
-1 , 0.024 m s
−1 and 0.032 m s
−1 , respectively.
2.4.2 Rebound Behavior in the Model Set up
In order to validate the COR measured in the classifier, the normal COR was also
determined in a model setup. This offers several advantages such as an easier comparison with available literature data and a more precise investigation of the impaction
behavior due to the improved magnification.
To acquire reliable data, the particles in the model set-up were accelerated in a
horizontal direction in a steel pipe, 100 mm long and 12 mm in diameter so that
the airflow did not slow down too much but the flow had a horizontal alignment (cf.
Fig. 5). The irregularly shaped particles of limestone with a diameter between 20
and 100 μm are first placed in the rubber storage box and then accelerated. A slot
geometry of 1 mm in diameter focused the particle flow in the focus area of the high
speed camera onto a 10 mm thick steel or marble plate.