

356
M. Weers et al.
Sphericity of a square
Sphericity of a equilateral triangle
0
2 0
4 0
6 0
8 0
1 0 0
0.4
0.5
0.6
0.7
0.8
0.9
1.0
Sphericity / -
Projection area equivalent diameter / μm
Sphericity of Saxolith 40 ± 1σ
for the shown interval
Sphericity of a square
Sphericity of a equilateral triangle
0
2 0
4 0
6 0
8 0
1 0 0
0.4
0.5
0.6
0.7
0.8
0.9
1.0
Sphericity / -
Projection area equivalent diameter / μm
Sphericity of Saxolith 70 ± 1σ
for the shown interval
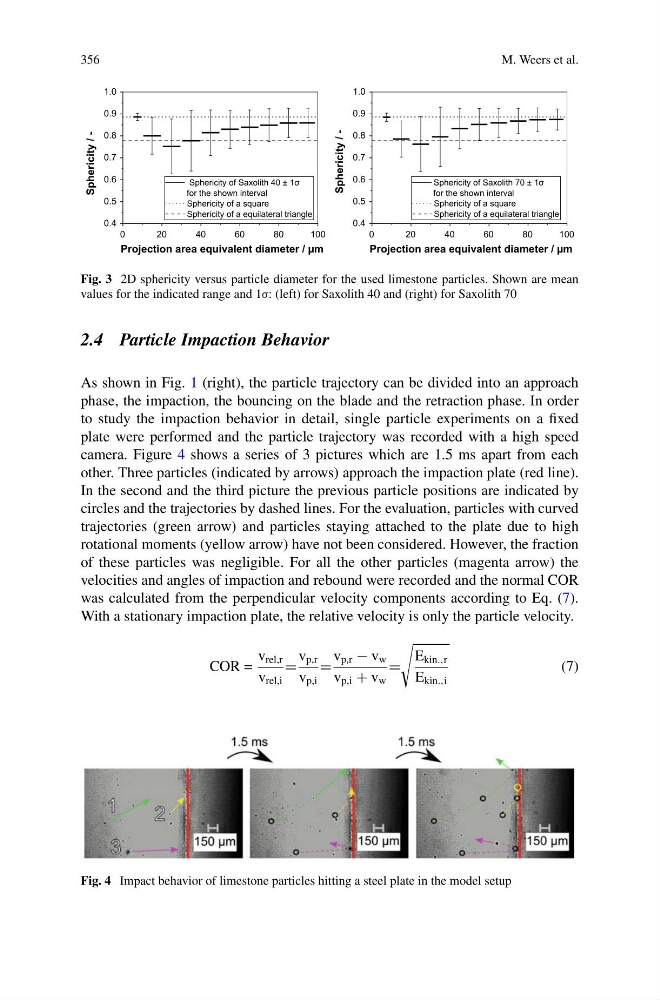
Fig. 3 2D sphericity versus particle diameter for the used limestone particles. Shown are mean
values for the indicated range and 1σ: (left) for Saxolith 40 and (right) for Saxolith 70
2.4 Particle Impaction Behavior
As shown in Fig. 1 (right), the particle trajectory can be divided into an approach
phase, the impaction, the bouncing on the blade and the retraction phase. In order
to study the impaction behavior in detail, single particle experiments on a fixed
plate were performed and the particle trajectory was recorded with a high speed
camera. Figure 4 shows a series of 3 pictures which are 1.5 ms apart from each
other. Three particles (indicated by arrows) approach the impaction plate (red line).
In the second and the third picture the previous particle positions are indicated by
circles and the trajectories by dashed lines. For the evaluation, particles with curved
trajectories (green arrow) and particles staying attached to the plate due to high
rotational moments (yellow arrow) have not been considered. However, the fraction
of these particles was negligible. For all the other particles (magenta arrow) the
velocities and angles of impaction and rebound were recorded and the normal COR
was calculated from the perpendicular velocity components according to Eq. (7).
With a stationary impaction plate, the relative velocity is only the particle velocity.
COR =
v rel,r
v rel,i
=
v p,r
v p,i
=
v p,r − v w
v p,i + v w
=
E kin.,r
E kin.,i
(7)
Fig. 4 Impact behavior of limestone particles hitting a steel plate in the model setup
M. Weers et al.
Sphericity of a square
Sphericity of a equilateral triangle
0
2 0
4 0
6 0
8 0
1 0 0
0.4
0.5
0.6
0.7
0.8
0.9
1.0
Sphericity / -
Projection area equivalent diameter / μm
Sphericity of Saxolith 40 ± 1σ
for the shown interval
Sphericity of a square
Sphericity of a equilateral triangle
0
2 0
4 0
6 0
8 0
1 0 0
0.4
0.5
0.6
0.7
0.8
0.9
1.0
Sphericity / -
Projection area equivalent diameter / μm
Sphericity of Saxolith 70 ± 1σ
for the shown interval
Fig. 3 2D sphericity versus particle diameter for the used limestone particles. Shown are mean
values for the indicated range and 1σ: (left) for Saxolith 40 and (right) for Saxolith 70
2.4 Particle Impaction Behavior
As shown in Fig. 1 (right), the particle trajectory can be divided into an approach
phase, the impaction, the bouncing on the blade and the retraction phase. In order
to study the impaction behavior in detail, single particle experiments on a fixed
plate were performed and the particle trajectory was recorded with a high speed
camera. Figure 4 shows a series of 3 pictures which are 1.5 ms apart from each
other. Three particles (indicated by arrows) approach the impaction plate (red line).
In the second and the third picture the previous particle positions are indicated by
circles and the trajectories by dashed lines. For the evaluation, particles with curved
trajectories (green arrow) and particles staying attached to the plate due to high
rotational moments (yellow arrow) have not been considered. However, the fraction
of these particles was negligible. For all the other particles (magenta arrow) the
velocities and angles of impaction and rebound were recorded and the normal COR
was calculated from the perpendicular velocity components according to Eq. (7).
With a stationary impaction plate, the relative velocity is only the particle velocity.
COR =
v rel,r
v rel,i
=
v p,r
v p,i
=
v p,r − v w
v p,i + v w
=
E kin.,r
E kin.,i
(7)
Fig. 4 Impact behavior of limestone particles hitting a steel plate in the model setup