

1 Process Modeling for Dynamic Disperse Particle Separation …
27
Table 3 Variation of geometry and material in the CFD simulations
Geometry variation
Material variation
Electrode
Name
Material
Density (kg m −3 )
Permittivity [–]
Wire
CaC0 3
Calcium-carbonat
2.71
8
Asymmetric spikes
Fe 2 O 3
Iron oxide
5.24
14.2
VP1
model
2.5
100
Symmetric spikes
VP2
model
25
100
VP3
model
2.5
1.8
3.5 Efficiency at Different Voltages
Numerous investigations on particle deposition in plate-wire electrostatic precipitators in the literature use electrodes as a 2-dimensional simple structure, which leads
to simplifications in terms of generated fields and ion concentrations both in laboratory experiments and in simulations. These wire electrode form serves here as a
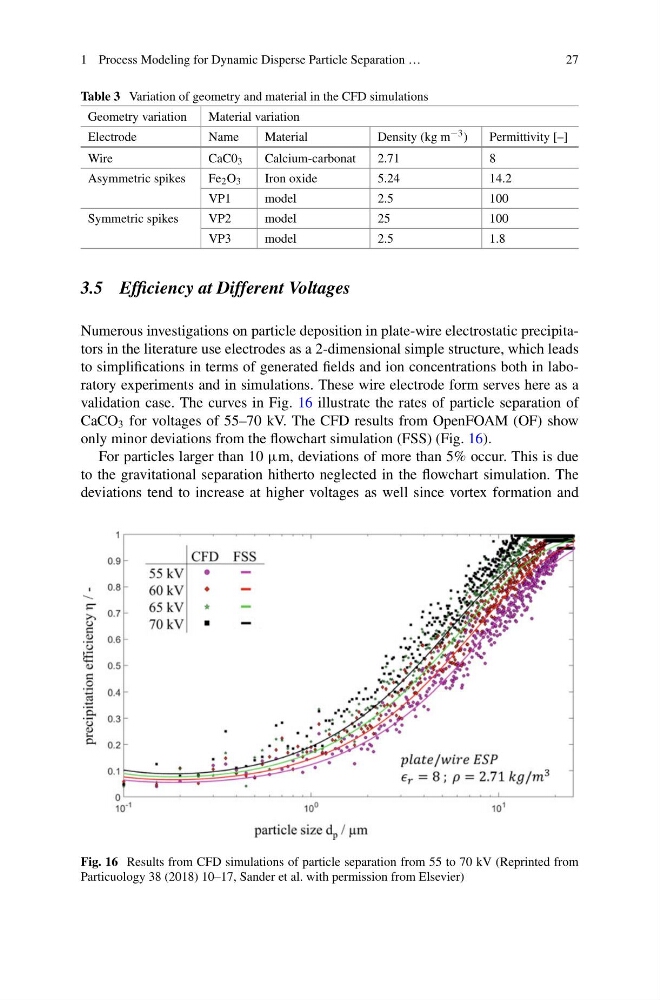
validation case. The curves in Fig. 16 illustrate the rates of particle separation of
CaCO 3 for voltages of 55–70 kV. The CFD results from OpenFOAM (OF) show
only minor deviations from the flowchart simulation (FSS) (Fig. 16).
For particles larger than 10 μm, deviations of more than 5% occur. This is due
to the gravitational separation hitherto neglected in the flowchart simulation. The
deviations tend to increase at higher voltages as well since vortex formation and
Fig. 16 Results from CFD simulations of particle separation from 55 to 70 kV (Reprinted from
Particuology 38 (2018) 10–17, Sander et al. with permission from Elsevier)
27
Table 3 Variation of geometry and material in the CFD simulations
Geometry variation
Material variation
Electrode
Name
Material
Density (kg m −3 )
Permittivity [–]
Wire
CaC0 3
Calcium-carbonat
2.71
8
Asymmetric spikes
Fe 2 O 3
Iron oxide
5.24
14.2
VP1
model
2.5
100
Symmetric spikes
VP2
model
25
100
VP3
model
2.5
1.8
3.5 Efficiency at Different Voltages
Numerous investigations on particle deposition in plate-wire electrostatic precipitators in the literature use electrodes as a 2-dimensional simple structure, which leads
to simplifications in terms of generated fields and ion concentrations both in laboratory experiments and in simulations. These wire electrode form serves here as a
validation case. The curves in Fig. 16 illustrate the rates of particle separation of
CaCO 3 for voltages of 55–70 kV. The CFD results from OpenFOAM (OF) show
only minor deviations from the flowchart simulation (FSS) (Fig. 16).
For particles larger than 10 μm, deviations of more than 5% occur. This is due
to the gravitational separation hitherto neglected in the flowchart simulation. The
deviations tend to increase at higher voltages as well since vortex formation and
Fig. 16 Results from CFD simulations of particle separation from 55 to 70 kV (Reprinted from
Particuology 38 (2018) 10–17, Sander et al. with permission from Elsevier)