

9 Impact Comminution in Jet Mills
335
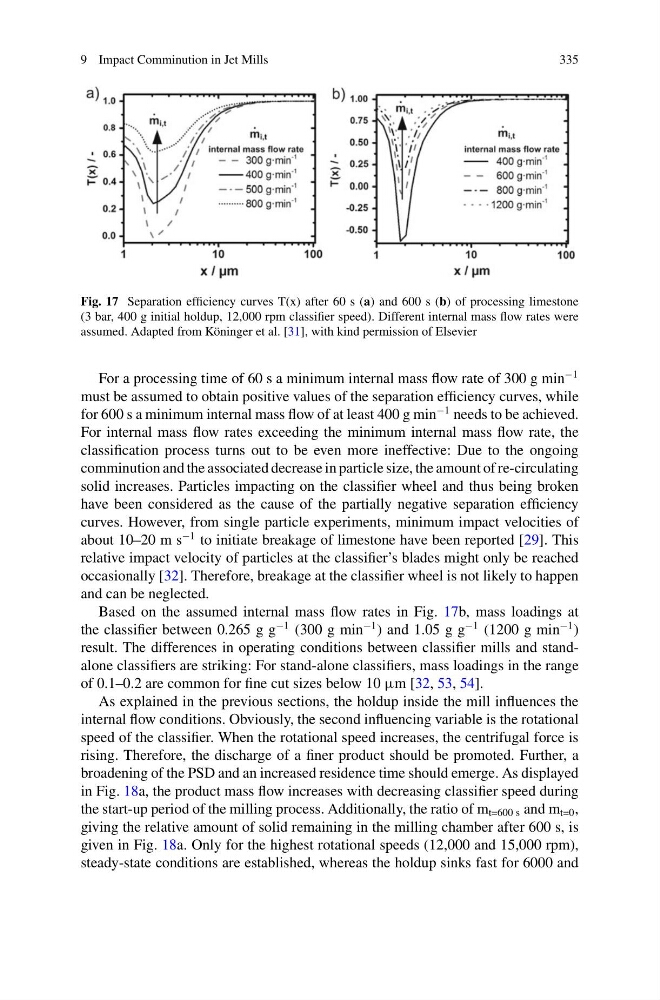
Fig. 17 Separation efficiency curves T(x) after 60 s (a) and 600 s (b) of processing limestone
(3 bar, 400 g initial holdup, 12,000 rpm classifier speed). Different internal mass flow rates were
assumed. Adapted from Köninger et al. [31], with kind permission of Elsevier
For a processing time of 60 s a minimum internal mass flow rate of 300 g min
−1
must be assumed to obtain positive values of the separation efficiency curves, while
for 600 s a minimum internal mass flow of at least 400 g min
−1 needs to be achieved.
For internal mass flow rates exceeding the minimum internal mass flow rate, the
classification process turns out to be even more ineffective: Due to the ongoing
comminution and the associated decrease in particle size, the amount of re-circulating
solid increases. Particles impacting on the classifier wheel and thus being broken
have been considered as the cause of the partially negative separation efficiency
curves. However, from single particle experiments, minimum impact velocities of
about 10–20 m s
−1 to initiate breakage of limestone have been reported [29]. This
relative impact velocity of particles at the classifier’s blades might only be reached
occasionally [32]. Therefore, breakage at the classifier wheel is not likely to happen
and can be neglected.
Based on the assumed internal mass flow rates in Fig. 17b, mass loadings at
the classifier between 0.265 g g
−1 (300 g min
−1 ) and 1.05 g g
−1 (1200 g min
−1 )
result. The differences in operating conditions between classifier mills and standalone classifiers are striking: For stand-alone classifiers, mass loadings in the range
of 0.1–0.2 are common for fine cut sizes below 10 μm [32, 53, 54].
As explained in the previous sections, the holdup inside the mill influences the
internal flow conditions. Obviously, the second influencing variable is the rotational
speed of the classifier. When the rotational speed increases, the centrifugal force is
rising. Therefore, the discharge of a finer product should be promoted. Further, a
broadening of the PSD and an increased residence time should emerge. As displayed
in Fig. 18a, the product mass flow increases with decreasing classifier speed during
the start-up period of the milling process. Additionally, the ratio of m t=600 s and m t=0 ,
giving the relative amount of solid remaining in the milling chamber after 600 s, is
given in Fig. 18a. Only for the highest rotational speeds (12,000 and 15,000 rpm),
steady-state conditions are established, whereas the holdup sinks fast for 6000 and
335
Fig. 17 Separation efficiency curves T(x) after 60 s (a) and 600 s (b) of processing limestone
(3 bar, 400 g initial holdup, 12,000 rpm classifier speed). Different internal mass flow rates were
assumed. Adapted from Köninger et al. [31], with kind permission of Elsevier
For a processing time of 60 s a minimum internal mass flow rate of 300 g min
−1
must be assumed to obtain positive values of the separation efficiency curves, while
for 600 s a minimum internal mass flow of at least 400 g min
−1 needs to be achieved.
For internal mass flow rates exceeding the minimum internal mass flow rate, the
classification process turns out to be even more ineffective: Due to the ongoing
comminution and the associated decrease in particle size, the amount of re-circulating
solid increases. Particles impacting on the classifier wheel and thus being broken
have been considered as the cause of the partially negative separation efficiency
curves. However, from single particle experiments, minimum impact velocities of
about 10–20 m s
−1 to initiate breakage of limestone have been reported [29]. This
relative impact velocity of particles at the classifier’s blades might only be reached
occasionally [32]. Therefore, breakage at the classifier wheel is not likely to happen
and can be neglected.
Based on the assumed internal mass flow rates in Fig. 17b, mass loadings at
the classifier between 0.265 g g
−1 (300 g min
−1 ) and 1.05 g g
−1 (1200 g min
−1 )
result. The differences in operating conditions between classifier mills and standalone classifiers are striking: For stand-alone classifiers, mass loadings in the range
of 0.1–0.2 are common for fine cut sizes below 10 μm [32, 53, 54].
As explained in the previous sections, the holdup inside the mill influences the
internal flow conditions. Obviously, the second influencing variable is the rotational
speed of the classifier. When the rotational speed increases, the centrifugal force is
rising. Therefore, the discharge of a finer product should be promoted. Further, a
broadening of the PSD and an increased residence time should emerge. As displayed
in Fig. 18a, the product mass flow increases with decreasing classifier speed during
the start-up period of the milling process. Additionally, the ratio of m t=600 s and m t=0 ,
giving the relative amount of solid remaining in the milling chamber after 600 s, is
given in Fig. 18a. Only for the highest rotational speeds (12,000 and 15,000 rpm),
steady-state conditions are established, whereas the holdup sinks fast for 6000 and