

334
A. Strobel et al.
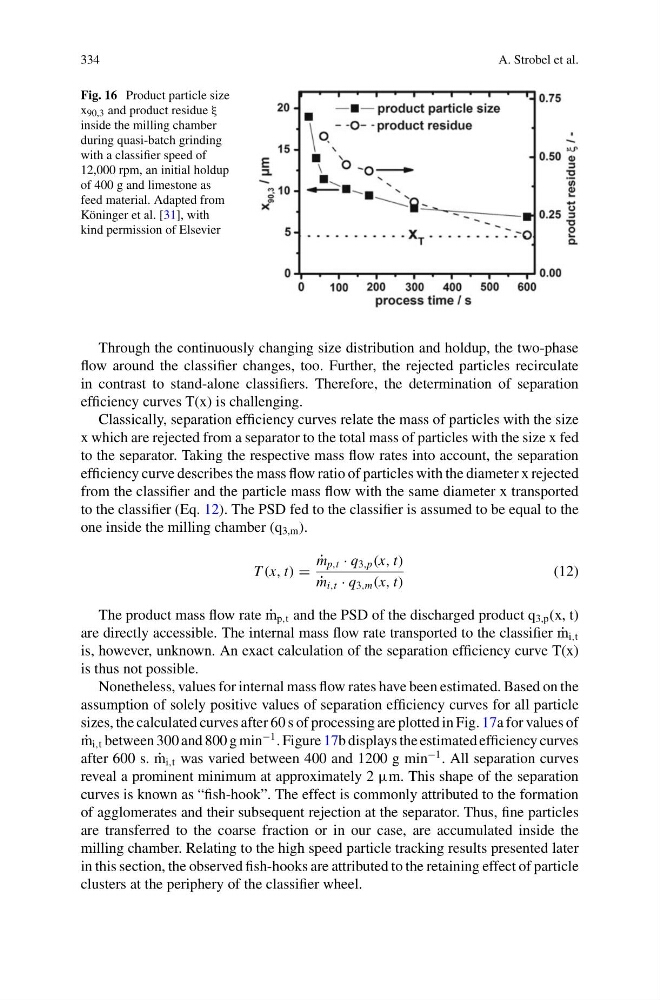
Fig. 16 Product particle size
x 90,3 and product residue ξ
inside the milling chamber
during quasi-batch grinding
with a classifier speed of
12,000 rpm, an initial holdup
of 400 g and limestone as
feed material. Adapted from
Köninger et al. [31], with
kind permission of Elsevier
Through the continuously changing size distribution and holdup, the two-phase
flow around the classifier changes, too. Further, the rejected particles recirculate
in contrast to stand-alone classifiers. Therefore, the determination of separation
efficiency curves T(x) is challenging.
Classically, separation efficiency curves relate the mass of particles with the size
x which are rejected from a separator to the total mass of particles with the size x fed
to the separator. Taking the respective mass flow rates into account, the separation
efficiency curve describes the mass flow ratio of particles with the diameter x rejected
from the classifier and the particle mass flow with the same diameter x transported
to the classifier (Eq. 12). The PSD fed to the classifier is assumed to be equal to the
one inside the milling chamber (q 3,m ).
T (x, t) =
˙
m p,t · q 3,p (x, t)
˙
m i,t · q 3,m (x, t)
(12)
The product mass flow rate ˙
m p,t and the PSD of the discharged product q 3,p (x, t)
are directly accessible. The internal mass flow rate transported to the classifier ˙
m i,t
is, however, unknown. An exact calculation of the separation efficiency curve T(x)
is thus not possible.
Nonetheless, values for internal mass flow rates have been estimated. Based on the
assumption of solely positive values of separation efficiency curves for all particle
sizes, the calculated curves after 60 s of processing are plotted in Fig. 17a for values of
˙
m i,t between 300 and 800 g min
−1 . Figure 17b displays the estimated efficiency curves
after 600 s. ˙
m i,t was varied between 400 and 1200 g min
−1 . All separation curves
reveal a prominent minimum at approximately 2 μm. This shape of the separation
curves is known as “fish-hook”. The effect is commonly attributed to the formation
of agglomerates and their subsequent rejection at the separator. Thus, fine particles
are transferred to the coarse fraction or in our case, are accumulated inside the
milling chamber. Relating to the high speed particle tracking results presented later
in this section, the observed fish-hooks are attributed to the retaining effect of particle
clusters at the periphery of the classifier wheel.
A. Strobel et al.
Fig. 16 Product particle size
x 90,3 and product residue ξ
inside the milling chamber
during quasi-batch grinding
with a classifier speed of
12,000 rpm, an initial holdup
of 400 g and limestone as
feed material. Adapted from
Köninger et al. [31], with
kind permission of Elsevier
Through the continuously changing size distribution and holdup, the two-phase
flow around the classifier changes, too. Further, the rejected particles recirculate
in contrast to stand-alone classifiers. Therefore, the determination of separation
efficiency curves T(x) is challenging.
Classically, separation efficiency curves relate the mass of particles with the size
x which are rejected from a separator to the total mass of particles with the size x fed
to the separator. Taking the respective mass flow rates into account, the separation
efficiency curve describes the mass flow ratio of particles with the diameter x rejected
from the classifier and the particle mass flow with the same diameter x transported
to the classifier (Eq. 12). The PSD fed to the classifier is assumed to be equal to the
one inside the milling chamber (q 3,m ).
T (x, t) =
˙
m p,t · q 3,p (x, t)
˙
m i,t · q 3,m (x, t)
(12)
The product mass flow rate ˙
m p,t and the PSD of the discharged product q 3,p (x, t)
are directly accessible. The internal mass flow rate transported to the classifier ˙
m i,t
is, however, unknown. An exact calculation of the separation efficiency curve T(x)
is thus not possible.
Nonetheless, values for internal mass flow rates have been estimated. Based on the
assumption of solely positive values of separation efficiency curves for all particle
sizes, the calculated curves after 60 s of processing are plotted in Fig. 17a for values of
˙
m i,t between 300 and 800 g min
−1 . Figure 17b displays the estimated efficiency curves
after 600 s. ˙
m i,t was varied between 400 and 1200 g min
−1 . All separation curves
reveal a prominent minimum at approximately 2 μm. This shape of the separation
curves is known as “fish-hook”. The effect is commonly attributed to the formation
of agglomerates and their subsequent rejection at the separator. Thus, fine particles
are transferred to the coarse fraction or in our case, are accumulated inside the
milling chamber. Relating to the high speed particle tracking results presented later
in this section, the observed fish-hooks are attributed to the retaining effect of particle
clusters at the periphery of the classifier wheel.