

9 Impact Comminution in Jet Mills
329
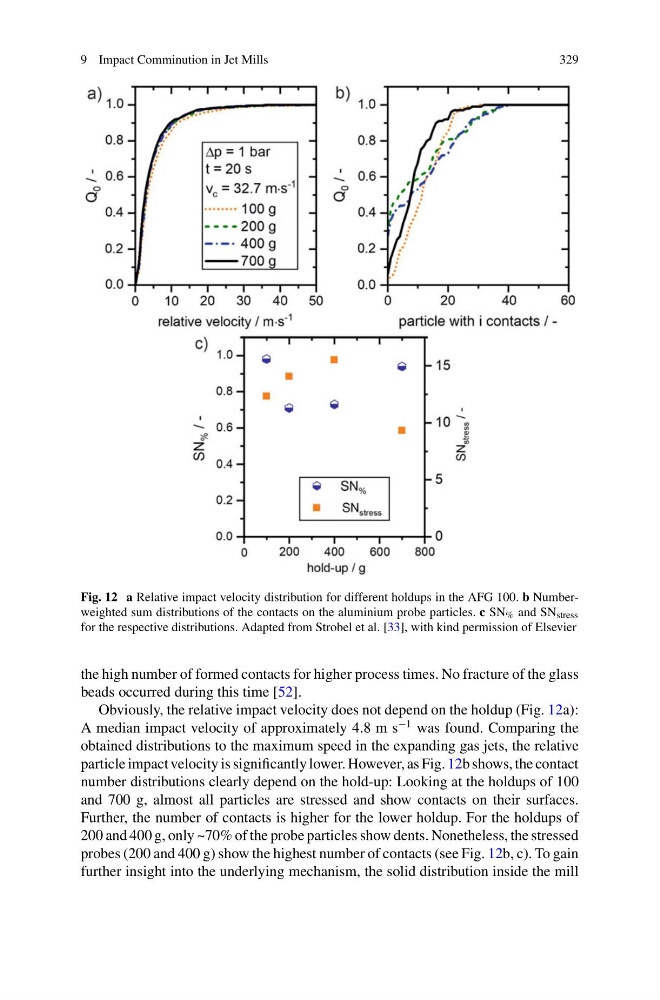
Fig. 12 a Relative impact velocity distribution for different holdups in the AFG 100. b Numberweighted sum distributions of the contacts on the aluminium probe particles. c SN % and SN stress
for the respective distributions. Adapted from Strobel et al. [33], with kind permission of Elsevier
the high number of formed contacts for higher process times. No fracture of the glass
beads occurred during this time [52].
Obviously, the relative impact velocity does not depend on the holdup (Fig. 12a):
A median impact velocity of approximately 4.8 m s
−1 was found. Comparing the
obtained distributions to the maximum speed in the expanding gas jets, the relative
particle impact velocity is significantly lower. However, as Fig. 12b shows, the contact
number distributions clearly depend on the hold-up: Looking at the holdups of 100
and 700 g, almost all particles are stressed and show contacts on their surfaces.
Further, the number of contacts is higher for the lower holdup. For the holdups of
200 and 400 g, only ~70% of the probe particles show dents. Nonetheless, the stressed
probes (200 and 400 g) show the highest number of contacts (see Fig. 12b, c). To gain
further insight into the underlying mechanism, the solid distribution inside the mill
329
Fig. 12 a Relative impact velocity distribution for different holdups in the AFG 100. b Numberweighted sum distributions of the contacts on the aluminium probe particles. c SN % and SN stress
for the respective distributions. Adapted from Strobel et al. [33], with kind permission of Elsevier
the high number of formed contacts for higher process times. No fracture of the glass
beads occurred during this time [52].
Obviously, the relative impact velocity does not depend on the holdup (Fig. 12a):
A median impact velocity of approximately 4.8 m s
−1 was found. Comparing the
obtained distributions to the maximum speed in the expanding gas jets, the relative
particle impact velocity is significantly lower. However, as Fig. 12b shows, the contact
number distributions clearly depend on the hold-up: Looking at the holdups of 100
and 700 g, almost all particles are stressed and show contacts on their surfaces.
Further, the number of contacts is higher for the lower holdup. For the holdups of
200 and 400 g, only ~70% of the probe particles show dents. Nonetheless, the stressed
probes (200 and 400 g) show the highest number of contacts (see Fig. 12b, c). To gain
further insight into the underlying mechanism, the solid distribution inside the mill