

9 Impact Comminution in Jet Mills
319
assigned to different classes, the particle was assigned to the class with higher associated impact energy. A minimum of 200 particles was evaluated per sample. The
number frequency of the four categories was determined according to Eq. 5:
number frequency =
number of particles with specific morphology type
number of all evaluated particles
(5)
Figure 6b shows the fracture modes for the quasi-batch grinding experiment after
processing for 20, 40, and 60 s: Within the first 40 s over 85% of the particles remained
unstressed or only traces of a low energy impact (chipping) are visible. Only 5–7%
of the spheres could be assigned to the highest impact class. After 60 s the number
of particles without visible damage drops significantly, whereas the proportion of
particles with several low energy marks on the surface, and particles which have
experienced a high-energy stress event (Hertzian cracks and high velocity form),
increases. All these observations are in good agreement with the observed trend in
Fig. 5. These results already suggest that lower grinding energies are dominant (e.g.,
in the jet perimeter) and, therefore rather surprisingly, the impact frequency is an
essential driving force in fine grinding, if not the most important one. After 60 s a
reasonable evaluation of the morphology is impossible due to the high amount of
created fines (represented by x 1,2 in Fig. 5).
However, this method gives no explicit values for the number of impacts and the
impact velocity. To target these values more precisely, a technique initially introduced
by Peukert and co-workers to characterize the stressing conditions in wet operated
stirred media mills [44–46] was adapted: The morphological changes of spherical,
well-characterized ductile metal particles are related to the relative particle impact
velocities prior to impact. Additionally, the exact number of dents on the particle surface gives information about the stressing frequency. This method will be presented
in detail in Sect. 3.3.
3.1.2 Modelling Grinding Kinetics
An excellent approach to modelling grinding kinetics—as proposed by Berthiaux and
Dodds [19]—is Kapur’s model for batch grinding [47], which is a simple measure
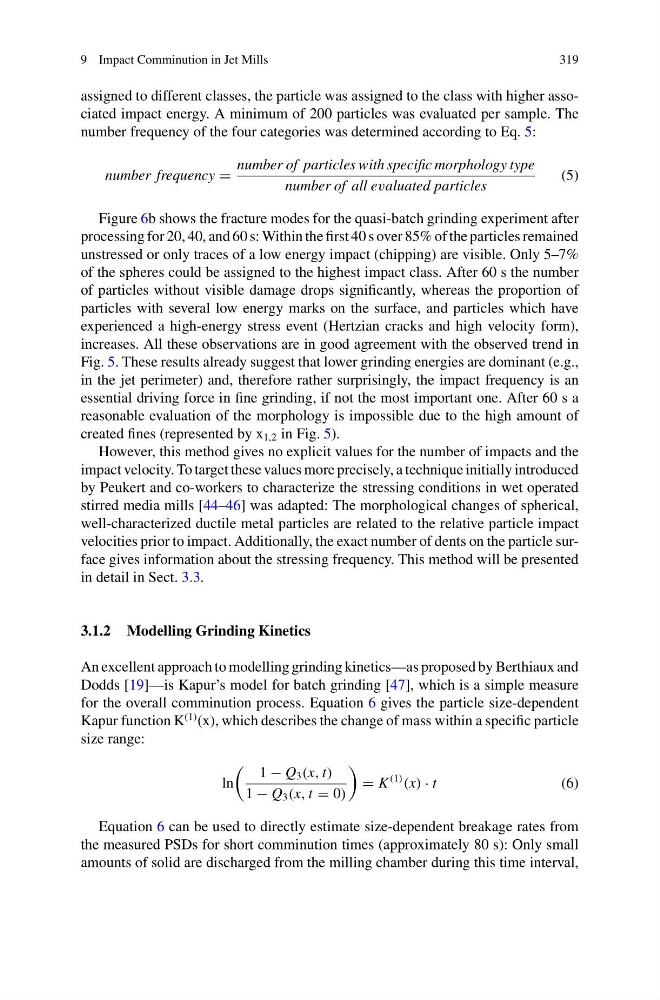
for the overall comminution process. Equation 6 gives the particle size-dependent
Kapur function K
(1) (x), which describes the change of mass within a specific particle
size range:
ln
1 − Q 3 (x, t)
1 − Q 3 (x, t = 0)
= K
(1)
(x) · t
(6)
Equation 6 can be used to directly estimate size-dependent breakage rates from
the measured PSDs for short comminution times (approximately 80 s): Only small
amounts of solid are discharged from the milling chamber during this time interval,
319
assigned to different classes, the particle was assigned to the class with higher associated impact energy. A minimum of 200 particles was evaluated per sample. The
number frequency of the four categories was determined according to Eq. 5:
number frequency =
number of particles with specific morphology type
number of all evaluated particles
(5)
Figure 6b shows the fracture modes for the quasi-batch grinding experiment after
processing for 20, 40, and 60 s: Within the first 40 s over 85% of the particles remained
unstressed or only traces of a low energy impact (chipping) are visible. Only 5–7%
of the spheres could be assigned to the highest impact class. After 60 s the number
of particles without visible damage drops significantly, whereas the proportion of
particles with several low energy marks on the surface, and particles which have
experienced a high-energy stress event (Hertzian cracks and high velocity form),
increases. All these observations are in good agreement with the observed trend in
Fig. 5. These results already suggest that lower grinding energies are dominant (e.g.,
in the jet perimeter) and, therefore rather surprisingly, the impact frequency is an
essential driving force in fine grinding, if not the most important one. After 60 s a
reasonable evaluation of the morphology is impossible due to the high amount of
created fines (represented by x 1,2 in Fig. 5).
However, this method gives no explicit values for the number of impacts and the
impact velocity. To target these values more precisely, a technique initially introduced
by Peukert and co-workers to characterize the stressing conditions in wet operated
stirred media mills [44–46] was adapted: The morphological changes of spherical,
well-characterized ductile metal particles are related to the relative particle impact
velocities prior to impact. Additionally, the exact number of dents on the particle surface gives information about the stressing frequency. This method will be presented
in detail in Sect. 3.3.
3.1.2 Modelling Grinding Kinetics
An excellent approach to modelling grinding kinetics—as proposed by Berthiaux and
Dodds [19]—is Kapur’s model for batch grinding [47], which is a simple measure
for the overall comminution process. Equation 6 gives the particle size-dependent
Kapur function K
(1) (x), which describes the change of mass within a specific particle
size range:
ln
1 − Q 3 (x, t)
1 − Q 3 (x, t = 0)
= K
(1)
(x) · t
(6)
Equation 6 can be used to directly estimate size-dependent breakage rates from
the measured PSDs for short comminution times (approximately 80 s): Only small
amounts of solid are discharged from the milling chamber during this time interval,