

296
M. Michaud et al.
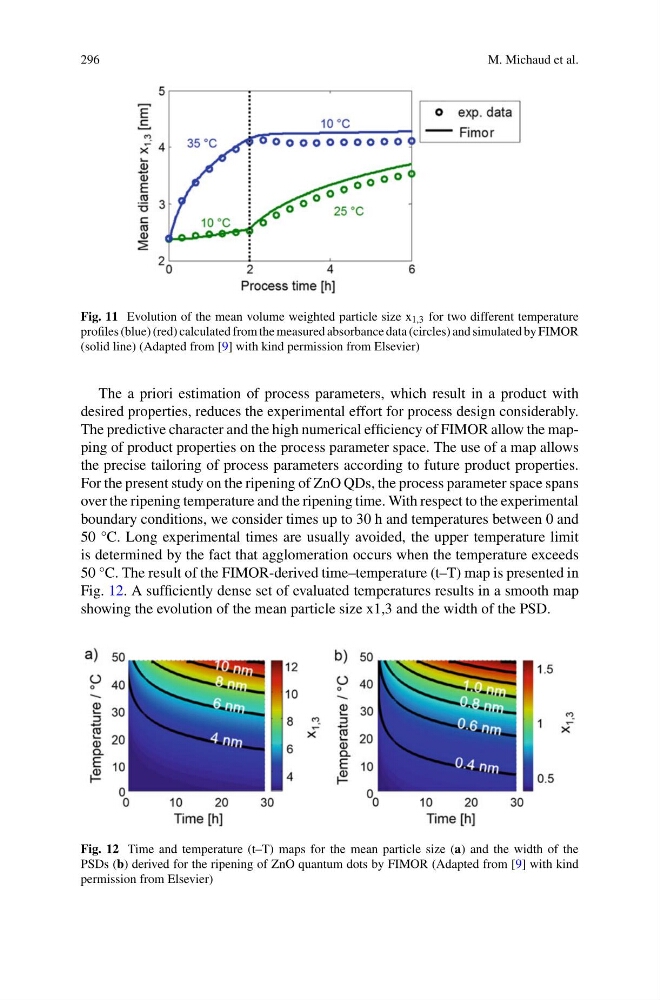
Fig. 11 Evolution of the mean volume weighted particle size x 1,3 for two different temperature
profiles (blue) (red) calculated from the measured absorbance data (circles) and simulated by FIMOR
(solid line) (Adapted from [9] with kind permission from Elsevier)
The a priori estimation of process parameters, which result in a product with
desired properties, reduces the experimental effort for process design considerably.
The predictive character and the high numerical efficiency of FIMOR allow the mapping of product properties on the process parameter space. The use of a map allows
the precise tailoring of process parameters according to future product properties.
For the present study on the ripening of ZnO QDs, the process parameter space spans
over the ripening temperature and the ripening time. With respect to the experimental
boundary conditions, we consider times up to 30 h and temperatures between 0 and
50 °C. Long experimental times are usually avoided, the upper temperature limit
is determined by the fact that agglomeration occurs when the temperature exceeds
50 °C. The result of the FIMOR-derived time–temperature (t–T) map is presented in
Fig. 12. A sufficiently dense set of evaluated temperatures results in a smooth map
showing the evolution of the mean particle size x1,3 and the width of the PSD.
Fig. 12 Time and temperature (t–T) maps for the mean particle size (a) and the width of the
PSDs (b) derived for the ripening of ZnO quantum dots by FIMOR (Adapted from [9] with kind
permission from Elsevier)
M. Michaud et al.
Fig. 11 Evolution of the mean volume weighted particle size x 1,3 for two different temperature
profiles (blue) (red) calculated from the measured absorbance data (circles) and simulated by FIMOR
(solid line) (Adapted from [9] with kind permission from Elsevier)
The a priori estimation of process parameters, which result in a product with
desired properties, reduces the experimental effort for process design considerably.
The predictive character and the high numerical efficiency of FIMOR allow the mapping of product properties on the process parameter space. The use of a map allows
the precise tailoring of process parameters according to future product properties.
For the present study on the ripening of ZnO QDs, the process parameter space spans
over the ripening temperature and the ripening time. With respect to the experimental
boundary conditions, we consider times up to 30 h and temperatures between 0 and
50 °C. Long experimental times are usually avoided, the upper temperature limit
is determined by the fact that agglomeration occurs when the temperature exceeds
50 °C. The result of the FIMOR-derived time–temperature (t–T) map is presented in
Fig. 12. A sufficiently dense set of evaluated temperatures results in a smooth map
showing the evolution of the mean particle size x1,3 and the width of the PSD.
Fig. 12 Time and temperature (t–T) maps for the mean particle size (a) and the width of the
PSDs (b) derived for the ripening of ZnO quantum dots by FIMOR (Adapted from [9] with kind
permission from Elsevier)