

8 Flowsheet Simulation of Integrated Precipitation Processes
295
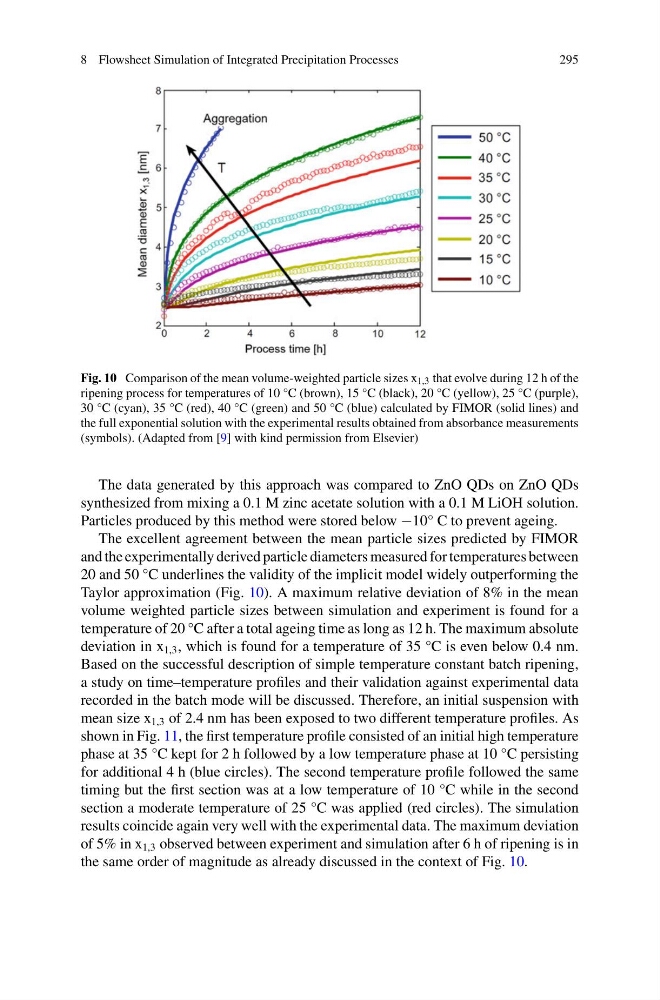
Fig. 10 Comparison of the mean volume-weighted particle sizes x 1,3 that evolve during 12 h of the
ripening process for temperatures of 10 °C (brown), 15 °C (black), 20 °C (yellow), 25 °C (purple),
30 °C (cyan), 35 °C (red), 40 °C (green) and 50 °C (blue) calculated by FIMOR (solid lines) and
the full exponential solution with the experimental results obtained from absorbance measurements
(symbols). (Adapted from [9] with kind permission from Elsevier)
The data generated by this approach was compared to ZnO QDs on ZnO QDs
synthesized from mixing a 0.1 M zinc acetate solution with a 0.1 M LiOH solution.
Particles produced by this method were stored below −10° C to prevent ageing.
The excellent agreement between the mean particle sizes predicted by FIMOR
and the experimentally derived particle diameters measured for temperatures between
20 and 50 °C underlines the validity of the implicit model widely outperforming the
Taylor approximation (Fig. 10). A maximum relative deviation of 8% in the mean
volume weighted particle sizes between simulation and experiment is found for a
temperature of 20 °C after a total ageing time as long as 12 h. The maximum absolute
deviation in x 1,3 , which is found for a temperature of 35 °C is even below 0.4 nm.
Based on the successful description of simple temperature constant batch ripening,
a study on time–temperature profiles and their validation against experimental data
recorded in the batch mode will be discussed. Therefore, an initial suspension with
mean size x 1,3 of 2.4 nm has been exposed to two different temperature profiles. As
shown in Fig. 11, the first temperature profile consisted of an initial high temperature
phase at 35 °C kept for 2 h followed by a low temperature phase at 10 °C persisting
for additional 4 h (blue circles). The second temperature profile followed the same
timing but the first section was at a low temperature of 10 °C while in the second
section a moderate temperature of 25 °C was applied (red circles). The simulation
results coincide again very well with the experimental data. The maximum deviation
of 5% in x 1,3 observed between experiment and simulation after 6 h of ripening is in
the same order of magnitude as already discussed in the context of Fig. 10.
295
Fig. 10 Comparison of the mean volume-weighted particle sizes x 1,3 that evolve during 12 h of the
ripening process for temperatures of 10 °C (brown), 15 °C (black), 20 °C (yellow), 25 °C (purple),
30 °C (cyan), 35 °C (red), 40 °C (green) and 50 °C (blue) calculated by FIMOR (solid lines) and
the full exponential solution with the experimental results obtained from absorbance measurements
(symbols). (Adapted from [9] with kind permission from Elsevier)
The data generated by this approach was compared to ZnO QDs on ZnO QDs
synthesized from mixing a 0.1 M zinc acetate solution with a 0.1 M LiOH solution.
Particles produced by this method were stored below −10° C to prevent ageing.
The excellent agreement between the mean particle sizes predicted by FIMOR
and the experimentally derived particle diameters measured for temperatures between
20 and 50 °C underlines the validity of the implicit model widely outperforming the
Taylor approximation (Fig. 10). A maximum relative deviation of 8% in the mean
volume weighted particle sizes between simulation and experiment is found for a
temperature of 20 °C after a total ageing time as long as 12 h. The maximum absolute
deviation in x 1,3 , which is found for a temperature of 35 °C is even below 0.4 nm.
Based on the successful description of simple temperature constant batch ripening,
a study on time–temperature profiles and their validation against experimental data
recorded in the batch mode will be discussed. Therefore, an initial suspension with
mean size x 1,3 of 2.4 nm has been exposed to two different temperature profiles. As
shown in Fig. 11, the first temperature profile consisted of an initial high temperature
phase at 35 °C kept for 2 h followed by a low temperature phase at 10 °C persisting
for additional 4 h (blue circles). The second temperature profile followed the same
timing but the first section was at a low temperature of 10 °C while in the second
section a moderate temperature of 25 °C was applied (red circles). The simulation
results coincide again very well with the experimental data. The maximum deviation
of 5% in x 1,3 observed between experiment and simulation after 6 h of ripening is in
the same order of magnitude as already discussed in the context of Fig. 10.