

8 Flowsheet Simulation of Integrated Precipitation Processes
297
Such t–T maps do not only allow a prediction of the dispersity of a sample for
different process conditions but also provide insights and improve the general understanding of the Ostwald ripening process. The evolution of the width of the PSDs
along the black isolines illustrated in Fig. 12 raises the question whether there is a
specific time/temperature combination to achieve a particularly narrow distribution.
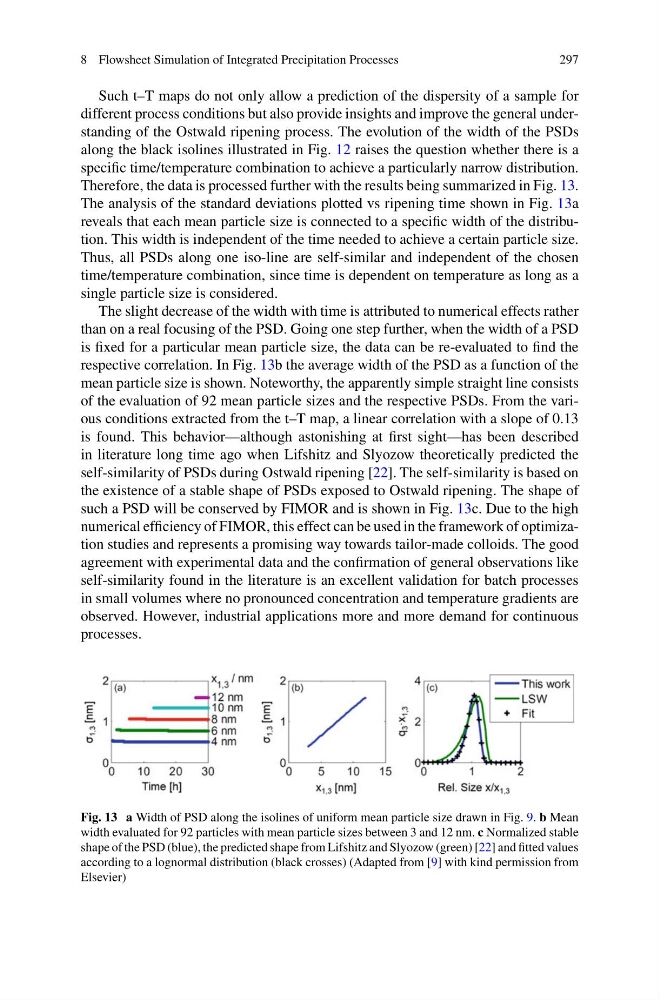
Therefore, the data is processed further with the results being summarized in Fig. 13.
The analysis of the standard deviations plotted vs ripening time shown in Fig. 13a
reveals that each mean particle size is connected to a specific width of the distribution. This width is independent of the time needed to achieve a certain particle size.
Thus, all PSDs along one iso-line are self-similar and independent of the chosen
time/temperature combination, since time is dependent on temperature as long as a
single particle size is considered.
The slight decrease of the width with time is attributed to numerical effects rather
than on a real focusing of the PSD. Going one step further, when the width of a PSD
is fixed for a particular mean particle size, the data can be re-evaluated to find the
respective correlation. In Fig. 13b the average width of the PSD as a function of the
mean particle size is shown. Noteworthy, the apparently simple straight line consists
of the evaluation of 92 mean particle sizes and the respective PSDs. From the various conditions extracted from the t–T map, a linear correlation with a slope of 0.13
is found. This behavior—although astonishing at first sight—has been described
in literature long time ago when Lifshitz and Slyozow theoretically predicted the
self-similarity of PSDs during Ostwald ripening [22]. The self-similarity is based on
the existence of a stable shape of PSDs exposed to Ostwald ripening. The shape of
such a PSD will be conserved by FIMOR and is shown in Fig. 13c. Due to the high
numerical efficiency of FIMOR, this effect can be used in the framework of optimization studies and represents a promising way towards tailor-made colloids. The good
agreement with experimental data and the confirmation of general observations like
self-similarity found in the literature is an excellent validation for batch processes
in small volumes where no pronounced concentration and temperature gradients are
observed. However, industrial applications more and more demand for continuous
processes.
Fig. 13 a Width of PSD along the isolines of uniform mean particle size drawn in Fig. 9. b Mean
width evaluated for 92 particles with mean particle sizes between 3 and 12 nm. c Normalized stable
shape of the PSD (blue), the predicted shape from Lifshitz and Slyozow (green) [22] and fitted values
according to a lognormal distribution (black crosses) (Adapted from [9] with kind permission from
Elsevier)
297
Such t–T maps do not only allow a prediction of the dispersity of a sample for
different process conditions but also provide insights and improve the general understanding of the Ostwald ripening process. The evolution of the width of the PSDs
along the black isolines illustrated in Fig. 12 raises the question whether there is a
specific time/temperature combination to achieve a particularly narrow distribution.
Therefore, the data is processed further with the results being summarized in Fig. 13.
The analysis of the standard deviations plotted vs ripening time shown in Fig. 13a
reveals that each mean particle size is connected to a specific width of the distribution. This width is independent of the time needed to achieve a certain particle size.
Thus, all PSDs along one iso-line are self-similar and independent of the chosen
time/temperature combination, since time is dependent on temperature as long as a
single particle size is considered.
The slight decrease of the width with time is attributed to numerical effects rather
than on a real focusing of the PSD. Going one step further, when the width of a PSD
is fixed for a particular mean particle size, the data can be re-evaluated to find the
respective correlation. In Fig. 13b the average width of the PSD as a function of the
mean particle size is shown. Noteworthy, the apparently simple straight line consists
of the evaluation of 92 mean particle sizes and the respective PSDs. From the various conditions extracted from the t–T map, a linear correlation with a slope of 0.13
is found. This behavior—although astonishing at first sight—has been described
in literature long time ago when Lifshitz and Slyozow theoretically predicted the
self-similarity of PSDs during Ostwald ripening [22]. The self-similarity is based on
the existence of a stable shape of PSDs exposed to Ostwald ripening. The shape of
such a PSD will be conserved by FIMOR and is shown in Fig. 13c. Due to the high
numerical efficiency of FIMOR, this effect can be used in the framework of optimization studies and represents a promising way towards tailor-made colloids. The good
agreement with experimental data and the confirmation of general observations like
self-similarity found in the literature is an excellent validation for batch processes
in small volumes where no pronounced concentration and temperature gradients are
observed. However, industrial applications more and more demand for continuous
processes.
Fig. 13 a Width of PSD along the isolines of uniform mean particle size drawn in Fig. 9. b Mean
width evaluated for 92 particles with mean particle sizes between 3 and 12 nm. c Normalized stable
shape of the PSD (blue), the predicted shape from Lifshitz and Slyozow (green) [22] and fitted values
according to a lognormal distribution (black crosses) (Adapted from [9] with kind permission from
Elsevier)