

292
M. Michaud et al.
goethite from solution under consumption of dissolved oxygen [3]. Goethite crystals are orthorhombic and typically elongated along the crystallographic 001 direction and terminated by the {021} faces at the end and {110} faces on the sides.
Since the surface energies of these faces are similar, the final particle shape is determined by aggregation kinetics rather than by thermodynamics [31]. For modeling,
the orthorhombic goethite crystals were considered as cylinders terminated by {021}
faces with the mantle surface considered as a {110} face. The multivariate aggregation model was then applied to the case of Brownian aggregation at 293 K in aqueous
solution. The source term was adapted for the case of cylindrical geometry. Since the
aggregation of cylindrical particles depends on both dimensions of the particles, it
provides additional challenges in contrast to monovariate aggregation processes such
as the aggregation of spheres. The resulting aggregation term provides data on the two
interacting particle dimensions and the particle geometry. Furthermore, aggregation
was modelled including van der Waals attraction between cylinders of different sizes
and electrostatic repulsion between the two crystal facets. For the latter, data for the
surface charge density of the two different crystal faces of goethite were used, which
were obtained from a multisite complexation model [32]: 46 mC/m
2 for the {110}
face and 57 mC/m
2 for the {021} face. The Hamaker constants were calculated by
[33]:
A = 24πγ D
2
0
(53)
where γ is the interfacial energy and D is the contact distance of two particles. The
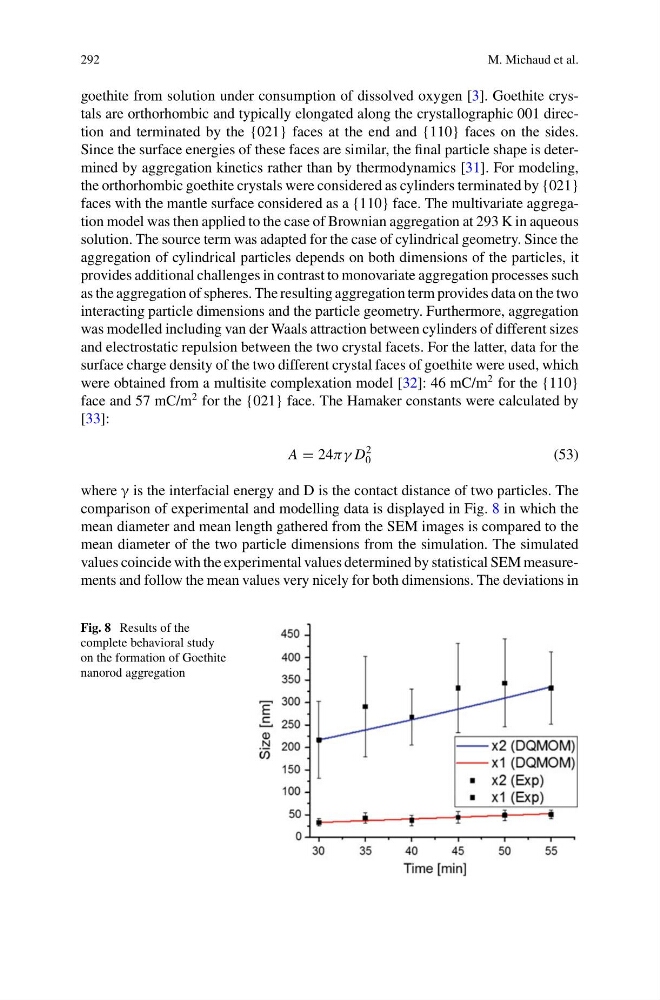
comparison of experimental and modelling data is displayed in Fig. 8 in which the
mean diameter and mean length gathered from the SEM images is compared to the
mean diameter of the two particle dimensions from the simulation. The simulated
values coincide with the experimental values determined by statistical SEM measurements and follow the mean values very nicely for both dimensions. The deviations in
Fig. 8 Results of the
complete behavioral study
on the formation of Goethite
nanorod aggregation
M. Michaud et al.
goethite from solution under consumption of dissolved oxygen [3]. Goethite crystals are orthorhombic and typically elongated along the crystallographic 001 direction and terminated by the {021} faces at the end and {110} faces on the sides.
Since the surface energies of these faces are similar, the final particle shape is determined by aggregation kinetics rather than by thermodynamics [31]. For modeling,
the orthorhombic goethite crystals were considered as cylinders terminated by {021}
faces with the mantle surface considered as a {110} face. The multivariate aggregation model was then applied to the case of Brownian aggregation at 293 K in aqueous
solution. The source term was adapted for the case of cylindrical geometry. Since the
aggregation of cylindrical particles depends on both dimensions of the particles, it
provides additional challenges in contrast to monovariate aggregation processes such
as the aggregation of spheres. The resulting aggregation term provides data on the two
interacting particle dimensions and the particle geometry. Furthermore, aggregation
was modelled including van der Waals attraction between cylinders of different sizes
and electrostatic repulsion between the two crystal facets. For the latter, data for the
surface charge density of the two different crystal faces of goethite were used, which
were obtained from a multisite complexation model [32]: 46 mC/m
2 for the {110}
face and 57 mC/m
2 for the {021} face. The Hamaker constants were calculated by
[33]:
A = 24πγ D
2
0
(53)
where γ is the interfacial energy and D is the contact distance of two particles. The
comparison of experimental and modelling data is displayed in Fig. 8 in which the
mean diameter and mean length gathered from the SEM images is compared to the
mean diameter of the two particle dimensions from the simulation. The simulated
values coincide with the experimental values determined by statistical SEM measurements and follow the mean values very nicely for both dimensions. The deviations in
Fig. 8 Results of the
complete behavioral study
on the formation of Goethite
nanorod aggregation