

276
M. Michaud et al.
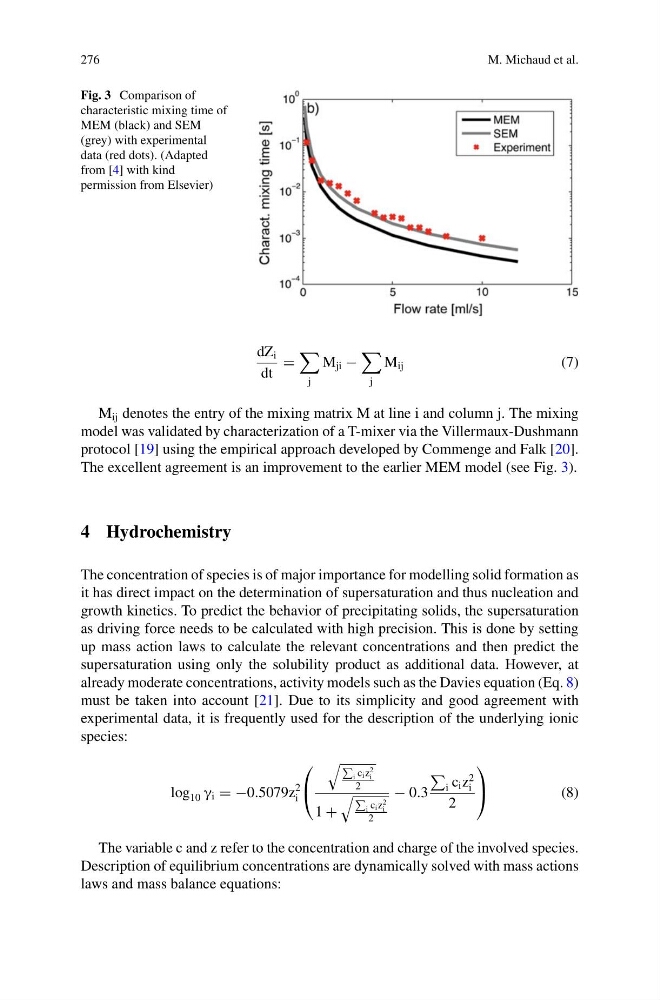
Fig. 3 Comparison of
characteristic mixing time of
MEM (black) and SEM
(grey) with experimental
data (red dots). (Adapted
from [4] with kind
permission from Elsevier)
dZ i
dt
=
j
M ji −
j
M ij
(7)
M ij denotes the entry of the mixing matrix M at line i and column j. The mixing
model was validated by characterization of a T-mixer via the Villermaux-Dushmann
protocol [19] using the empirical approach developed by Commenge and Falk [20].
The excellent agreement is an improvement to the earlier MEM model (see Fig. 3).
4 Hydrochemistry
The concentration of species is of major importance for modelling solid formation as
it has direct impact on the determination of supersaturation and thus nucleation and
growth kinetics. To predict the behavior of precipitating solids, the supersaturation
as driving force needs to be calculated with high precision. This is done by setting
up mass action laws to calculate the relevant concentrations and then predict the
supersaturation using only the solubility product as additional data. However, at
already moderate concentrations, activity models such as the Davies equation (Eq. 8)
must be taken into account [21]. Due to its simplicity and good agreement with
experimental data, it is frequently used for the description of the underlying ionic
species:
log 10 γ i = −0.5079z
2
i
⎛
⎝
i c i z
2
i
2
1 +
i c i z
2
i
2
− 0.3
i c i z
2
i
2
⎞
⎠
(8)
The variable c and z refer to the concentration and charge of the involved species.
Description of equilibrium concentrations are dynamically solved with mass actions
laws and mass balance equations:
M. Michaud et al.
Fig. 3 Comparison of
characteristic mixing time of
MEM (black) and SEM
(grey) with experimental
data (red dots). (Adapted
from [4] with kind
permission from Elsevier)
dZ i
dt
=
j
M ji −
j
M ij
(7)
M ij denotes the entry of the mixing matrix M at line i and column j. The mixing
model was validated by characterization of a T-mixer via the Villermaux-Dushmann
protocol [19] using the empirical approach developed by Commenge and Falk [20].
The excellent agreement is an improvement to the earlier MEM model (see Fig. 3).
4 Hydrochemistry
The concentration of species is of major importance for modelling solid formation as
it has direct impact on the determination of supersaturation and thus nucleation and
growth kinetics. To predict the behavior of precipitating solids, the supersaturation
as driving force needs to be calculated with high precision. This is done by setting
up mass action laws to calculate the relevant concentrations and then predict the
supersaturation using only the solubility product as additional data. However, at
already moderate concentrations, activity models such as the Davies equation (Eq. 8)
must be taken into account [21]. Due to its simplicity and good agreement with
experimental data, it is frequently used for the description of the underlying ionic
species:
log 10 γ i = −0.5079z
2
i
⎛
⎝
i c i z
2
i
2
1 +
i c i z
2
i
2
− 0.3
i c i z
2
i
2
⎞
⎠
(8)
The variable c and z refer to the concentration and charge of the involved species.
Description of equilibrium concentrations are dynamically solved with mass actions
laws and mass balance equations: