

7 Dynamic Simulation of Mechanical Fluid Separation in Solid …
263
Table 3 Summary of the key
data of the investigated
tubular centrifuge
Parameter
Value (m)
Rotor length
0.18
Drum radius
0.0215
Weir radius
0.0152
Number of compartments
50
Number of sediment slices
100
Number of particle classes
100
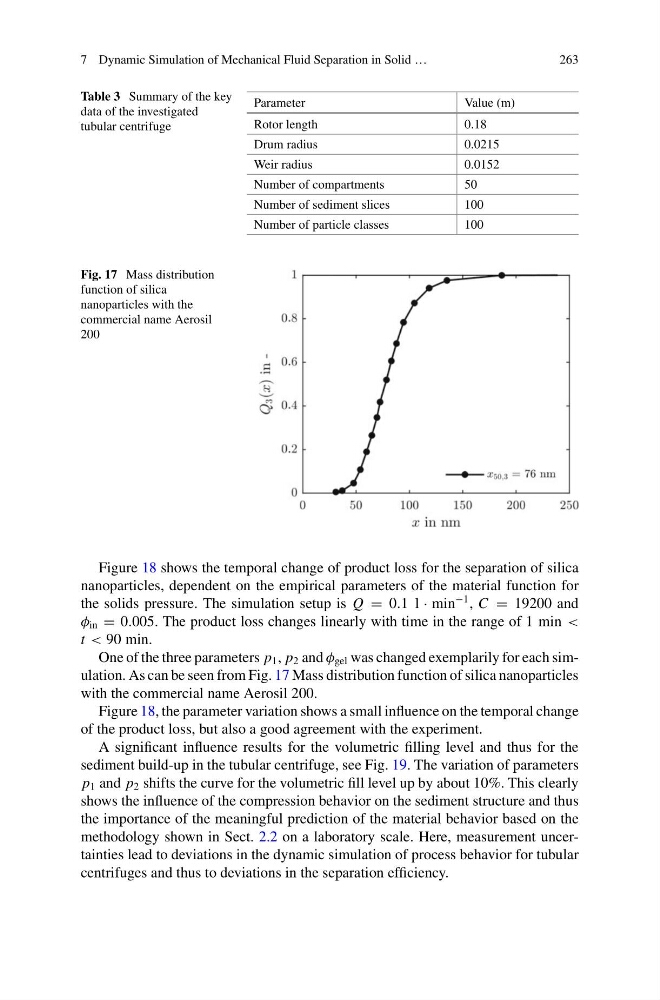
Fig. 17 Mass distribution
function of silica
nanoparticles with the
commercial name Aerosil
200
Figure 18 shows the temporal change of product loss for the separation of silica
nanoparticles, dependent on the empirical parameters of the material function for
the solids pressure. The simulation setup is Q = 0.1 l · min
−1 , C = 19200 and
φ in = 0.005. The product loss changes linearly with time in the range of 1 min <
t < 90 min.
One of the three parameters p 1 , p 2 and φ gel was changed exemplarily for each simulation. As can be seen from Fig. 17 Mass distribution function of silica nanoparticles
with the commercial name Aerosil 200.
Figure 18, the parameter variation shows a small influence on the temporal change
of the product loss, but also a good agreement with the experiment.
A significant influence results for the volumetric filling level and thus for the
sediment build-up in the tubular centrifuge, see Fig. 19. The variation of parameters
p 1 and p 2 shifts the curve for the volumetric fill level up by about 10%. This clearly
shows the influence of the compression behavior on the sediment structure and thus
the importance of the meaningful prediction of the material behavior based on the
methodology shown in Sect. 2.2 on a laboratory scale. Here, measurement uncertainties lead to deviations in the dynamic simulation of process behavior for tubular
centrifuges and thus to deviations in the separation efficiency.
263
Table 3 Summary of the key
data of the investigated
tubular centrifuge
Parameter
Value (m)
Rotor length
0.18
Drum radius
0.0215
Weir radius
0.0152
Number of compartments
50
Number of sediment slices
100
Number of particle classes
100
Fig. 17 Mass distribution
function of silica
nanoparticles with the
commercial name Aerosil
200
Figure 18 shows the temporal change of product loss for the separation of silica
nanoparticles, dependent on the empirical parameters of the material function for
the solids pressure. The simulation setup is Q = 0.1 l · min
−1 , C = 19200 and
φ in = 0.005. The product loss changes linearly with time in the range of 1 min <
t < 90 min.
One of the three parameters p 1 , p 2 and φ gel was changed exemplarily for each simulation. As can be seen from Fig. 17 Mass distribution function of silica nanoparticles
with the commercial name Aerosil 200.
Figure 18, the parameter variation shows a small influence on the temporal change
of the product loss, but also a good agreement with the experiment.
A significant influence results for the volumetric filling level and thus for the
sediment build-up in the tubular centrifuge, see Fig. 19. The variation of parameters
p 1 and p 2 shifts the curve for the volumetric fill level up by about 10%. This clearly
shows the influence of the compression behavior on the sediment structure and thus
the importance of the meaningful prediction of the material behavior based on the
methodology shown in Sect. 2.2 on a laboratory scale. Here, measurement uncertainties lead to deviations in the dynamic simulation of process behavior for tubular
centrifuges and thus to deviations in the separation efficiency.