

256
M. Gleiss and H. Nirschl
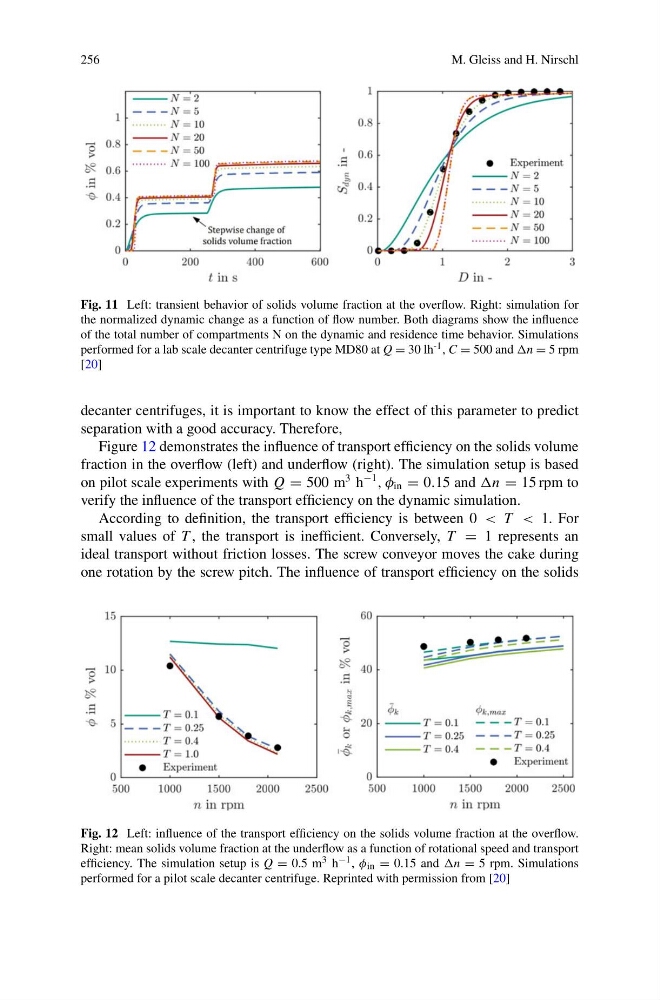
Fig. 11 Left: transient behavior of solids volume fraction at the overflow. Right: simulation for
the normalized dynamic change as a function of flow number. Both diagrams show the influence
of the total number of compartments N on the dynamic and residence time behavior. Simulations
performed for a lab scale decanter centrifuge type MD80 at Q = 30 lh -1 , C = 500 and n = 5 rpm
[20]
decanter centrifuges, it is important to know the effect of this parameter to predict
separation with a good accuracy. Therefore,
Figure 12 demonstrates the influence of transport efficiency on the solids volume
fraction in the overflow (left) and underflow (right). The simulation setup is based
on pilot scale experiments with Q = 500 m
3 h
−1
, φ in = 0.15 and n = 15 rpm to
verify the influence of the transport efficiency on the dynamic simulation.
According to definition, the transport efficiency is between 0 < T < 1. For
small values of T , the transport is inefficient. Conversely, T = 1 represents an
ideal transport without friction losses. The screw conveyor moves the cake during
one rotation by the screw pitch. The influence of transport efficiency on the solids
Fig. 12 Left: influence of the transport efficiency on the solids volume fraction at the overflow.
Right: mean solids volume fraction at the underflow as a function of rotational speed and transport
efficiency. The simulation setup is Q = 0.5 m 3 h −1 , φ in = 0.15 and n = 5 rpm. Simulations
performed for a pilot scale decanter centrifuge. Reprinted with permission from [20]
M. Gleiss and H. Nirschl
Fig. 11 Left: transient behavior of solids volume fraction at the overflow. Right: simulation for
the normalized dynamic change as a function of flow number. Both diagrams show the influence
of the total number of compartments N on the dynamic and residence time behavior. Simulations
performed for a lab scale decanter centrifuge type MD80 at Q = 30 lh -1 , C = 500 and n = 5 rpm
[20]
decanter centrifuges, it is important to know the effect of this parameter to predict
separation with a good accuracy. Therefore,
Figure 12 demonstrates the influence of transport efficiency on the solids volume
fraction in the overflow (left) and underflow (right). The simulation setup is based
on pilot scale experiments with Q = 500 m
3 h
−1
, φ in = 0.15 and n = 15 rpm to
verify the influence of the transport efficiency on the dynamic simulation.
According to definition, the transport efficiency is between 0 < T < 1. For
small values of T , the transport is inefficient. Conversely, T = 1 represents an
ideal transport without friction losses. The screw conveyor moves the cake during
one rotation by the screw pitch. The influence of transport efficiency on the solids
Fig. 12 Left: influence of the transport efficiency on the solids volume fraction at the overflow.
Right: mean solids volume fraction at the underflow as a function of rotational speed and transport
efficiency. The simulation setup is Q = 0.5 m 3 h −1 , φ in = 0.15 and n = 5 rpm. Simulations
performed for a pilot scale decanter centrifuge. Reprinted with permission from [20]