

1 Process Modeling for Dynamic Disperse Particle Separation …
17
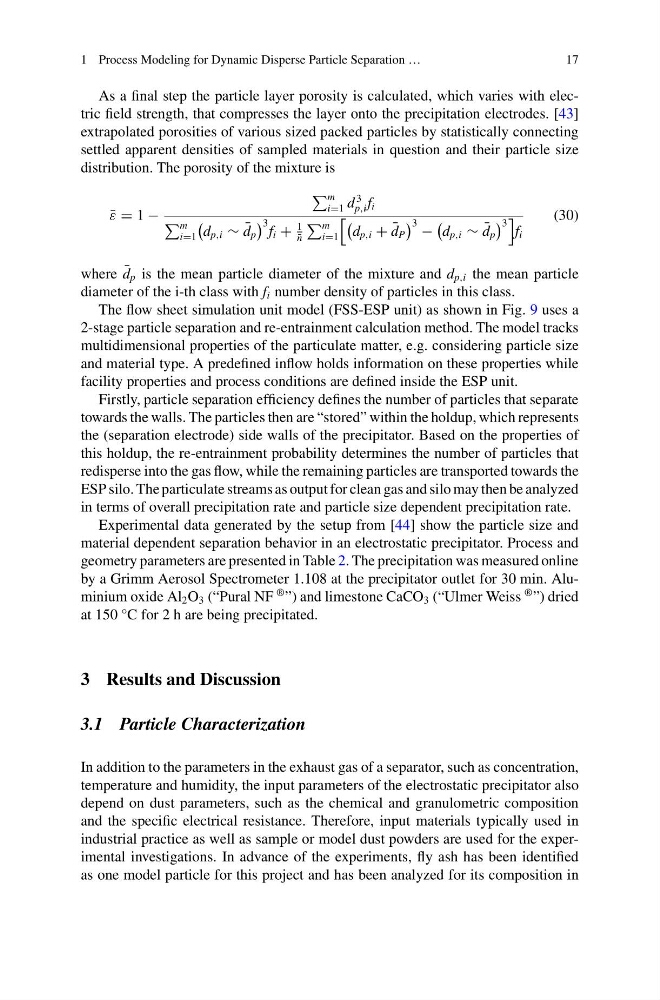
As a final step the particle layer porosity is calculated, which varies with electric field strength, that compresses the layer onto the precipitation electrodes. [43]
extrapolated porosities of various sized packed particles by statistically connecting
settled apparent densities of sampled materials in question and their particle size
distribution. The porosity of the mixture is
¯
ε = 1 −
m
i=1 d
3
p,i f i
m
i=1
d p,i ∼ ¯
d p
3 f i +
1
¯
n
m
i=1
d p,i + ¯
d P
3 −
d p,i ∼ ¯
d p
3
f i
(30)
where ¯
d p is the mean particle diameter of the mixture and d p,i the mean particle
diameter of the i-th class with f i number density of particles in this class.
The flow sheet simulation unit model (FSS-ESP unit) as shown in Fig. 9 uses a
2-stage particle separation and re-entrainment calculation method. The model tracks
multidimensional properties of the particulate matter, e.g. considering particle size
and material type. A predefined inflow holds information on these properties while
facility properties and process conditions are defined inside the ESP unit.
Firstly, particle separation efficiency defines the number of particles that separate
towards the walls. The particles then are “stored” within the holdup, which represents
the (separation electrode) side walls of the precipitator. Based on the properties of
this holdup, the re-entrainment probability determines the number of particles that
redisperse into the gas flow, while the remaining particles are transported towards the
ESP silo. The particulate streams as output for clean gas and silo may then be analyzed
in terms of overall precipitation rate and particle size dependent precipitation rate.
Experimental data generated by the setup from [44] show the particle size and
material dependent separation behavior in an electrostatic precipitator. Process and
geometry parameters are presented in Table 2. The precipitation was measured online
by a Grimm Aerosol Spectrometer 1.108 at the precipitator outlet for 30 min. Aluminium oxide Al 2 O 3 (“Pural NF
® ”) and limestone CaCO 3 (“Ulmer Weiss
® ”) dried
at 150 °C for 2 h are being precipitated.
3 Results and Discussion
3.1 Particle Characterization
In addition to the parameters in the exhaust gas of a separator, such as concentration,
temperature and humidity, the input parameters of the electrostatic precipitator also
depend on dust parameters, such as the chemical and granulometric composition
and the specific electrical resistance. Therefore, input materials typically used in
industrial practice as well as sample or model dust powders are used for the experimental investigations. In advance of the experiments, fly ash has been identified
as one model particle for this project and has been analyzed for its composition in
17
As a final step the particle layer porosity is calculated, which varies with electric field strength, that compresses the layer onto the precipitation electrodes. [43]
extrapolated porosities of various sized packed particles by statistically connecting
settled apparent densities of sampled materials in question and their particle size
distribution. The porosity of the mixture is
¯
ε = 1 −
m
i=1 d
3
p,i f i
m
i=1
d p,i ∼ ¯
d p
3 f i +
1
¯
n
m
i=1
d p,i + ¯
d P
3 −
d p,i ∼ ¯
d p
3
f i
(30)
where ¯
d p is the mean particle diameter of the mixture and d p,i the mean particle
diameter of the i-th class with f i number density of particles in this class.
The flow sheet simulation unit model (FSS-ESP unit) as shown in Fig. 9 uses a
2-stage particle separation and re-entrainment calculation method. The model tracks
multidimensional properties of the particulate matter, e.g. considering particle size
and material type. A predefined inflow holds information on these properties while
facility properties and process conditions are defined inside the ESP unit.
Firstly, particle separation efficiency defines the number of particles that separate
towards the walls. The particles then are “stored” within the holdup, which represents
the (separation electrode) side walls of the precipitator. Based on the properties of
this holdup, the re-entrainment probability determines the number of particles that
redisperse into the gas flow, while the remaining particles are transported towards the
ESP silo. The particulate streams as output for clean gas and silo may then be analyzed
in terms of overall precipitation rate and particle size dependent precipitation rate.
Experimental data generated by the setup from [44] show the particle size and
material dependent separation behavior in an electrostatic precipitator. Process and
geometry parameters are presented in Table 2. The precipitation was measured online
by a Grimm Aerosol Spectrometer 1.108 at the precipitator outlet for 30 min. Aluminium oxide Al 2 O 3 (“Pural NF
® ”) and limestone CaCO 3 (“Ulmer Weiss
® ”) dried
at 150 °C for 2 h are being precipitated.
3 Results and Discussion
3.1 Particle Characterization
In addition to the parameters in the exhaust gas of a separator, such as concentration,
temperature and humidity, the input parameters of the electrostatic precipitator also
depend on dust parameters, such as the chemical and granulometric composition
and the specific electrical resistance. Therefore, input materials typically used in
industrial practice as well as sample or model dust powders are used for the experimental investigations. In advance of the experiments, fly ash has been identified
as one model particle for this project and has been analyzed for its composition in