

6 Dynamic Process Models for Fine Grinding and Dispersing
231
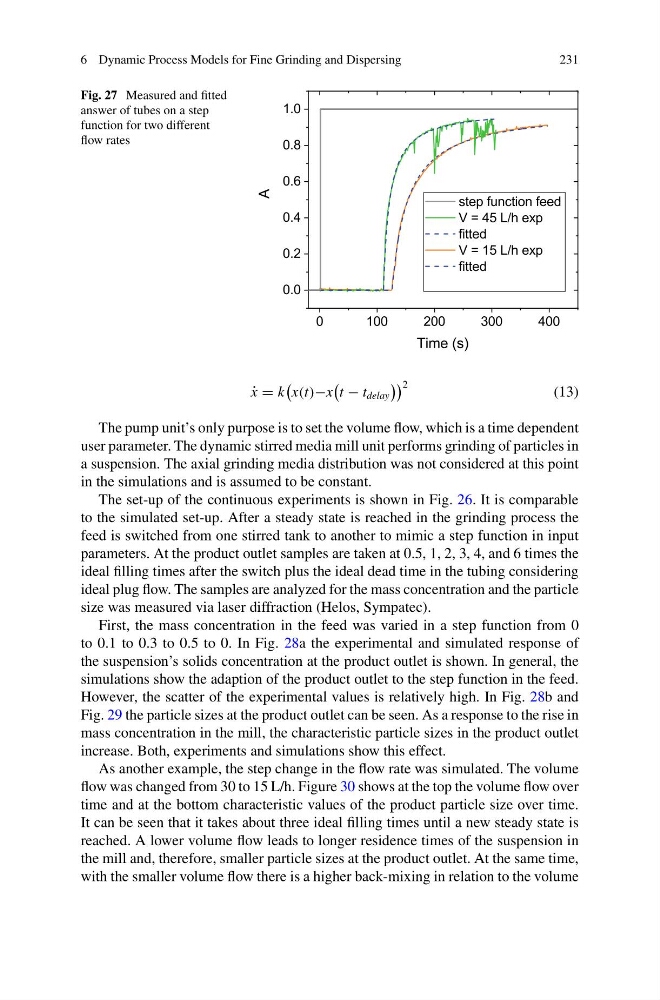
Fig. 27 Measured and fitted
answer of tubes on a step
function for two different
flow rates
˙
x = k
x(t)−x
t − t delay
2
(13)
The pump unit’s only purpose is to set the volume flow, which is a time dependent
user parameter. The dynamic stirred media mill unit performs grinding of particles in
a suspension. The axial grinding media distribution was not considered at this point
in the simulations and is assumed to be constant.
The set-up of the continuous experiments is shown in Fig. 26. It is comparable
to the simulated set-up. After a steady state is reached in the grinding process the
feed is switched from one stirred tank to another to mimic a step function in input
parameters. At the product outlet samples are taken at 0.5, 1, 2, 3, 4, and 6 times the
ideal filling times after the switch plus the ideal dead time in the tubing considering
ideal plug flow. The samples are analyzed for the mass concentration and the particle
size was measured via laser diffraction (Helos, Sympatec).
First, the mass concentration in the feed was varied in a step function from 0
to 0.1 to 0.3 to 0.5 to 0. In Fig. 28a the experimental and simulated response of
the suspension’s solids concentration at the product outlet is shown. In general, the
simulations show the adaption of the product outlet to the step function in the feed.
However, the scatter of the experimental values is relatively high. In Fig. 28b and
Fig. 29 the particle sizes at the product outlet can be seen. As a response to the rise in
mass concentration in the mill, the characteristic particle sizes in the product outlet
increase. Both, experiments and simulations show this effect.
As another example, the step change in the flow rate was simulated. The volume
flow was changed from 30 to 15 L/h. Figure 30 shows at the top the volume flow over
time and at the bottom characteristic values of the product particle size over time.
It can be seen that it takes about three ideal filling times until a new steady state is
reached. A lower volume flow leads to longer residence times of the suspension in
the mill and, therefore, smaller particle sizes at the product outlet. At the same time,
with the smaller volume flow there is a higher back-mixing in relation to the volume
231
Fig. 27 Measured and fitted
answer of tubes on a step
function for two different
flow rates
˙
x = k
x(t)−x
t − t delay
2
(13)
The pump unit’s only purpose is to set the volume flow, which is a time dependent
user parameter. The dynamic stirred media mill unit performs grinding of particles in
a suspension. The axial grinding media distribution was not considered at this point
in the simulations and is assumed to be constant.
The set-up of the continuous experiments is shown in Fig. 26. It is comparable
to the simulated set-up. After a steady state is reached in the grinding process the
feed is switched from one stirred tank to another to mimic a step function in input
parameters. At the product outlet samples are taken at 0.5, 1, 2, 3, 4, and 6 times the
ideal filling times after the switch plus the ideal dead time in the tubing considering
ideal plug flow. The samples are analyzed for the mass concentration and the particle
size was measured via laser diffraction (Helos, Sympatec).
First, the mass concentration in the feed was varied in a step function from 0
to 0.1 to 0.3 to 0.5 to 0. In Fig. 28a the experimental and simulated response of
the suspension’s solids concentration at the product outlet is shown. In general, the
simulations show the adaption of the product outlet to the step function in the feed.
However, the scatter of the experimental values is relatively high. In Fig. 28b and
Fig. 29 the particle sizes at the product outlet can be seen. As a response to the rise in
mass concentration in the mill, the characteristic particle sizes in the product outlet
increase. Both, experiments and simulations show this effect.
As another example, the step change in the flow rate was simulated. The volume
flow was changed from 30 to 15 L/h. Figure 30 shows at the top the volume flow over
time and at the bottom characteristic values of the product particle size over time.
It can be seen that it takes about three ideal filling times until a new steady state is
reached. A lower volume flow leads to longer residence times of the suspension in
the mill and, therefore, smaller particle sizes at the product outlet. At the same time,
with the smaller volume flow there is a higher back-mixing in relation to the volume