

232
G. Fragnière et al.
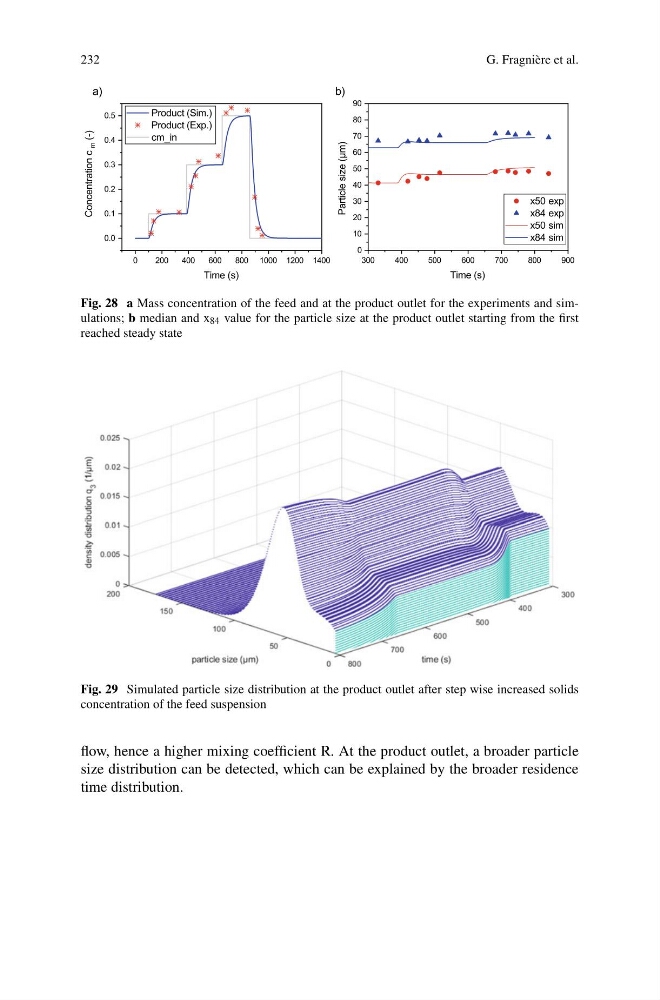
Fig. 28 a Mass concentration of the feed and at the product outlet for the experiments and simulations; b median and x 84 value for the particle size at the product outlet starting from the first
reached steady state
Fig. 29 Simulated particle size distribution at the product outlet after step wise increased solids
concentration of the feed suspension
flow, hence a higher mixing coefficient R. At the product outlet, a broader particle
size distribution can be detected, which can be explained by the broader residence
time distribution.
G. Fragnière et al.
Fig. 28 a Mass concentration of the feed and at the product outlet for the experiments and simulations; b median and x 84 value for the particle size at the product outlet starting from the first
reached steady state
Fig. 29 Simulated particle size distribution at the product outlet after step wise increased solids
concentration of the feed suspension
flow, hence a higher mixing coefficient R. At the product outlet, a broader particle
size distribution can be detected, which can be explained by the broader residence
time distribution.