

226
G. Fragnière et al.
M
CIR
Salt injection
a)
b)
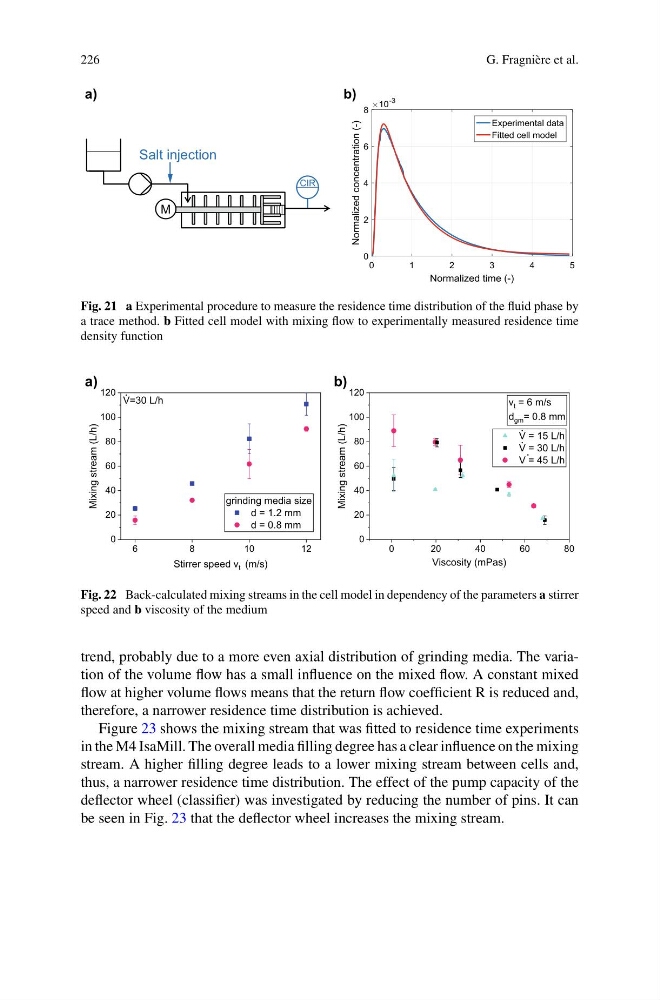
Fig. 21 a Experimental procedure to measure the residence time distribution of the fluid phase by
a trace method. b Fitted cell model with mixing flow to experimentally measured residence time
density function
0
2 0
4 0
6 0
8 0
0
20
40
60
80
100
120
v t = 6 m/s
d gm = 0.8 mm
Mixing stream (L/h)
Viscosity (mPas)
V = 15 L/h
V = 30 L/h
V = 45 L/h
6
8
10
12
0
20
40
60
80
100
120
grinding media size
d = 1.2 mm
d = 0.8 mm
V=30 L/h
Mixing stream (L/h)
Stirrer speed v t (m/s)
a)
b)
Fig. 22 Back-calculated mixing streams in the cell model in dependency of the parameters a stirrer
speed and b viscosity of the medium
trend, probably due to a more even axial distribution of grinding media. The variation of the volume flow has a small influence on the mixed flow. A constant mixed
flow at higher volume flows means that the return flow coefficient R is reduced and,
therefore, a narrower residence time distribution is achieved.
Figure 23 shows the mixing stream that was fitted to residence time experiments
in the M4 IsaMill. The overall media filling degree has a clear influence on the mixing
stream. A higher filling degree leads to a lower mixing stream between cells and,
thus, a narrower residence time distribution. The effect of the pump capacity of the
deflector wheel (classifier) was investigated by reducing the number of pins. It can
be seen in Fig. 23 that the deflector wheel increases the mixing stream.
G. Fragnière et al.
M
CIR
Salt injection
a)
b)
Fig. 21 a Experimental procedure to measure the residence time distribution of the fluid phase by
a trace method. b Fitted cell model with mixing flow to experimentally measured residence time
density function
0
2 0
4 0
6 0
8 0
0
20
40
60
80
100
120
v t = 6 m/s
d gm = 0.8 mm
Mixing stream (L/h)
Viscosity (mPas)
V = 15 L/h
V = 30 L/h
V = 45 L/h
6
8
10
12
0
20
40
60
80
100
120
grinding media size
d = 1.2 mm
d = 0.8 mm
V=30 L/h
Mixing stream (L/h)
Stirrer speed v t (m/s)
a)
b)
Fig. 22 Back-calculated mixing streams in the cell model in dependency of the parameters a stirrer
speed and b viscosity of the medium
trend, probably due to a more even axial distribution of grinding media. The variation of the volume flow has a small influence on the mixed flow. A constant mixed
flow at higher volume flows means that the return flow coefficient R is reduced and,
therefore, a narrower residence time distribution is achieved.
Figure 23 shows the mixing stream that was fitted to residence time experiments
in the M4 IsaMill. The overall media filling degree has a clear influence on the mixing
stream. A higher filling degree leads to a lower mixing stream between cells and,
thus, a narrower residence time distribution. The effect of the pump capacity of the
deflector wheel (classifier) was investigated by reducing the number of pins. It can
be seen in Fig. 23 that the deflector wheel increases the mixing stream.