

168
D. Markauskas and H. Kruggel-Emden
0
0.1
0.2
0.3
0.4
0.5
0.6
0.7
0.8
0.9
1
0
0.05
0.1
0.15
0.2
0.25
0.3
0.35
Fraction retained [-]
Screen length [m]
Amplitude
2.64mm
Amplitude
2.2mm
Amplitude
1.76mm
Amplitude
1.32mm
0
0.1
0.2
0.3
0.4
0.5
0.6
0.7
0.8
0.9
1
0
0.05
0.1
0.15
0.2
0.25
0.3
0.35
Fraction retained [-]
Screen length [m]
Frequency
41.4Hz
Frequency
34.5Hz
Frequency
27.6Hz
Frequency
20.7Hz
Spheres
Double cones
Volume equivalent cylinders
a
b
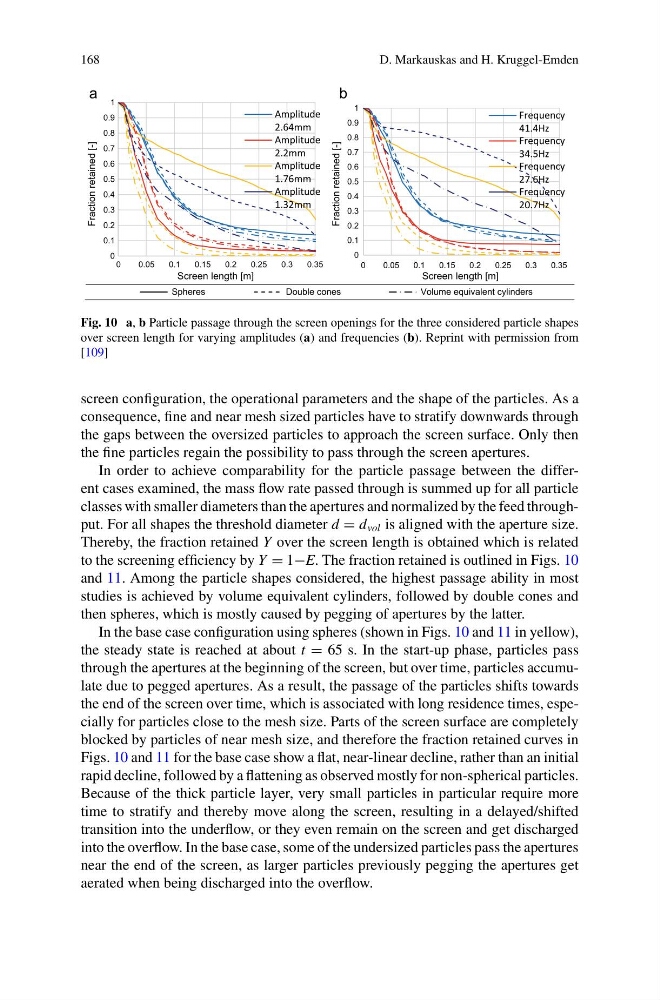
Fig. 10 a, b Particle passage through the screen openings for the three considered particle shapes
over screen length for varying amplitudes (a) and frequencies (b). Reprint with permission from
[109]
screen configuration, the operational parameters and the shape of the particles. As a
consequence, fine and near mesh sized particles have to stratify downwards through
the gaps between the oversized particles to approach the screen surface. Only then
the fine particles regain the possibility to pass through the screen apertures.
In order to achieve comparability for the particle passage between the different cases examined, the mass flow rate passed through is summed up for all particle
classes with smaller diameters than the apertures and normalized by the feed throughput. For all shapes the threshold diameter d = d vol is aligned with the aperture size.
Thereby, the fraction retained Y over the screen length is obtained which is related
to the screening efficiency by Y = 1−E. The fraction retained is outlined in Figs. 10
and 11. Among the particle shapes considered, the highest passage ability in most
studies is achieved by volume equivalent cylinders, followed by double cones and
then spheres, which is mostly caused by pegging of apertures by the latter.
In the base case configuration using spheres (shown in Figs. 10 and 11 in yellow),
the steady state is reached at about t = 65 s. In the start-up phase, particles pass
through the apertures at the beginning of the screen, but over time, particles accumulate due to pegged apertures. As a result, the passage of the particles shifts towards
the end of the screen over time, which is associated with long residence times, especially for particles close to the mesh size. Parts of the screen surface are completely
blocked by particles of near mesh size, and therefore the fraction retained curves in
Figs. 10 and 11 for the base case show a flat, near-linear decline, rather than an initial
rapid decline, followed by a flattening as observed mostly for non-spherical particles.
Because of the thick particle layer, very small particles in particular require more
time to stratify and thereby move along the screen, resulting in a delayed/shifted
transition into the underflow, or they even remain on the screen and get discharged
into the overflow. In the base case, some of the undersized particles pass the apertures
near the end of the screen, as larger particles previously pegging the apertures get
aerated when being discharged into the overflow.
D. Markauskas and H. Kruggel-Emden
0
0.1
0.2
0.3
0.4
0.5
0.6
0.7
0.8
0.9
1
0
0.05
0.1
0.15
0.2
0.25
0.3
0.35
Fraction retained [-]
Screen length [m]
Amplitude
2.64mm
Amplitude
2.2mm
Amplitude
1.76mm
Amplitude
1.32mm
0
0.1
0.2
0.3
0.4
0.5
0.6
0.7
0.8
0.9
1
0
0.05
0.1
0.15
0.2
0.25
0.3
0.35
Fraction retained [-]
Screen length [m]
Frequency
41.4Hz
Frequency
34.5Hz
Frequency
27.6Hz
Frequency
20.7Hz
Spheres
Double cones
Volume equivalent cylinders
a
b
Fig. 10 a, b Particle passage through the screen openings for the three considered particle shapes
over screen length for varying amplitudes (a) and frequencies (b). Reprint with permission from
[109]
screen configuration, the operational parameters and the shape of the particles. As a
consequence, fine and near mesh sized particles have to stratify downwards through
the gaps between the oversized particles to approach the screen surface. Only then
the fine particles regain the possibility to pass through the screen apertures.
In order to achieve comparability for the particle passage between the different cases examined, the mass flow rate passed through is summed up for all particle
classes with smaller diameters than the apertures and normalized by the feed throughput. For all shapes the threshold diameter d = d vol is aligned with the aperture size.
Thereby, the fraction retained Y over the screen length is obtained which is related
to the screening efficiency by Y = 1−E. The fraction retained is outlined in Figs. 10
and 11. Among the particle shapes considered, the highest passage ability in most
studies is achieved by volume equivalent cylinders, followed by double cones and
then spheres, which is mostly caused by pegging of apertures by the latter.
In the base case configuration using spheres (shown in Figs. 10 and 11 in yellow),
the steady state is reached at about t = 65 s. In the start-up phase, particles pass
through the apertures at the beginning of the screen, but over time, particles accumulate due to pegged apertures. As a result, the passage of the particles shifts towards
the end of the screen over time, which is associated with long residence times, especially for particles close to the mesh size. Parts of the screen surface are completely
blocked by particles of near mesh size, and therefore the fraction retained curves in
Figs. 10 and 11 for the base case show a flat, near-linear decline, rather than an initial
rapid decline, followed by a flattening as observed mostly for non-spherical particles.
Because of the thick particle layer, very small particles in particular require more
time to stratify and thereby move along the screen, resulting in a delayed/shifted
transition into the underflow, or they even remain on the screen and get discharged
into the overflow. In the base case, some of the undersized particles pass the apertures
near the end of the screen, as larger particles previously pegging the apertures get
aerated when being discharged into the overflow.