

5 Development of a Dynamic-Physical Process Model for Sieving
167
equivalent diameter of a complex shaped particle is calculated from its volume as
d vol =
3
√
6 · V /π , where V is the volume of the particle.
DEM parameters were used for the simulations in accordance with Delaney et al.
[125] and Cleary [15] applicable for standard industrial quarry rock, with the stiffness
of the normal spring k
n
= 1000 N/m, the stiffness of the tangential spring k
t
=
500 N/m, the particle-particle restitution coefficient e
n
PW = 0.4, the particle-wall
restitution coefficient e
n
PW = 0.5, and the particle-particle and particle-wall friction
coefficients μ c,PP = μ c,PW = 0.5.
4.1.2 Results and Discussions
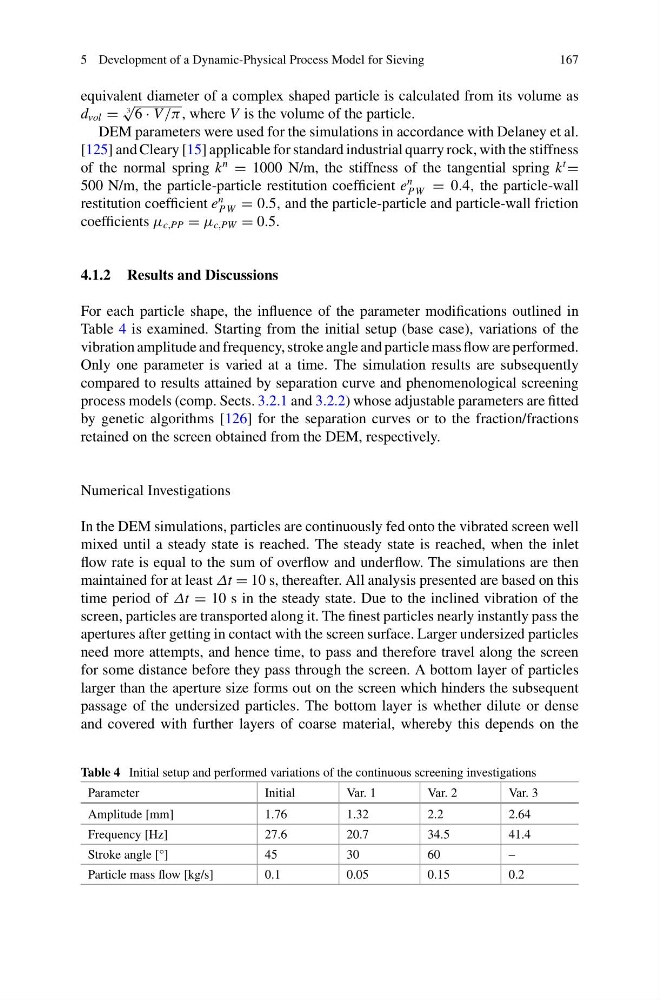
For each particle shape, the influence of the parameter modifications outlined in
Table 4 is examined. Starting from the initial setup (base case), variations of the
vibration amplitude and frequency, stroke angle and particle mass flow are performed.
Only one parameter is varied at a time. The simulation results are subsequently
compared to results attained by separation curve and phenomenological screening
process models (comp. Sects. 3.2.1 and 3.2.2) whose adjustable parameters are fitted
by genetic algorithms [126] for the separation curves or to the fraction/fractions
retained on the screen obtained from the DEM, respectively.
Numerical Investigations
In the DEM simulations, particles are continuously fed onto the vibrated screen well
mixed until a steady state is reached. The steady state is reached, when the inlet
flow rate is equal to the sum of overflow and underflow. The simulations are then
maintained for at least Δt = 10 s, thereafter. All analysis presented are based on this
time period of Δt = 10 s in the steady state. Due to the inclined vibration of the
screen, particles are transported along it. The finest particles nearly instantly pass the
apertures after getting in contact with the screen surface. Larger undersized particles
need more attempts, and hence time, to pass and therefore travel along the screen
for some distance before they pass through the screen. A bottom layer of particles
larger than the aperture size forms out on the screen which hinders the subsequent
passage of the undersized particles. The bottom layer is whether dilute or dense
and covered with further layers of coarse material, whereby this depends on the
Table 4 Initial setup and performed variations of the continuous screening investigations
Parameter
Initial
Var. 1
Var. 2
Var. 3
Amplitude [mm]
1.76
1.32
2.2
2.64
Frequency [Hz]
27.6
20.7
34.5
41.4
Stroke angle [°]
45
30
60
–
Particle mass flow [kg/s]
0.1
0.05
0.15
0.2
167
equivalent diameter of a complex shaped particle is calculated from its volume as
d vol =
3
√
6 · V /π , where V is the volume of the particle.
DEM parameters were used for the simulations in accordance with Delaney et al.
[125] and Cleary [15] applicable for standard industrial quarry rock, with the stiffness
of the normal spring k
n
= 1000 N/m, the stiffness of the tangential spring k
t
=
500 N/m, the particle-particle restitution coefficient e
n
PW = 0.4, the particle-wall
restitution coefficient e
n
PW = 0.5, and the particle-particle and particle-wall friction
coefficients μ c,PP = μ c,PW = 0.5.
4.1.2 Results and Discussions
For each particle shape, the influence of the parameter modifications outlined in
Table 4 is examined. Starting from the initial setup (base case), variations of the
vibration amplitude and frequency, stroke angle and particle mass flow are performed.
Only one parameter is varied at a time. The simulation results are subsequently
compared to results attained by separation curve and phenomenological screening
process models (comp. Sects. 3.2.1 and 3.2.2) whose adjustable parameters are fitted
by genetic algorithms [126] for the separation curves or to the fraction/fractions
retained on the screen obtained from the DEM, respectively.
Numerical Investigations
In the DEM simulations, particles are continuously fed onto the vibrated screen well
mixed until a steady state is reached. The steady state is reached, when the inlet
flow rate is equal to the sum of overflow and underflow. The simulations are then
maintained for at least Δt = 10 s, thereafter. All analysis presented are based on this
time period of Δt = 10 s in the steady state. Due to the inclined vibration of the
screen, particles are transported along it. The finest particles nearly instantly pass the
apertures after getting in contact with the screen surface. Larger undersized particles
need more attempts, and hence time, to pass and therefore travel along the screen
for some distance before they pass through the screen. A bottom layer of particles
larger than the aperture size forms out on the screen which hinders the subsequent
passage of the undersized particles. The bottom layer is whether dilute or dense
and covered with further layers of coarse material, whereby this depends on the
Table 4 Initial setup and performed variations of the continuous screening investigations
Parameter
Initial
Var. 1
Var. 2
Var. 3
Amplitude [mm]
1.76
1.32
2.2
2.64
Frequency [Hz]
27.6
20.7
34.5
41.4
Stroke angle [°]
45
30
60
–
Particle mass flow [kg/s]
0.1
0.05
0.15
0.2