

4 Dynamic Simulation of Technical Precipitation Processes
117
BaCl 2
Na 2 SO 4
P 2
P 1
M
S
P 3
CIJM
Product
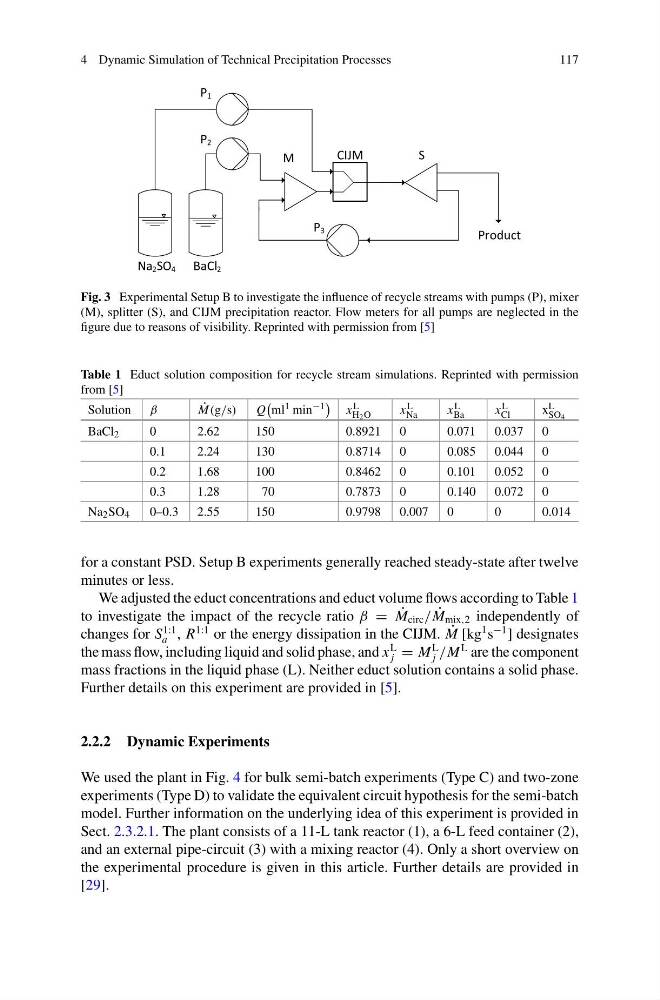
Fig. 3 Experimental Setup B to investigate the influence of recycle streams with pumps (P), mixer
(M), splitter (S), and CIJM precipitation reactor. Flow meters for all pumps are neglected in the
figure due to reasons of visibility. Reprinted with permission from [5]
Table 1 Educt solution composition for recycle stream simulations. Reprinted with permission
from [5]
Solution β
˙
M(g/s)
Q
ml 1 min −1
x L
H2O
x L
Na
x L
Ba
x L
Cl
x L
SO4
BaCl 2
0
2.62
150
0.8921 0
0.071 0.037 0
0.1
2.24
130
0.8714 0
0.085 0.044 0
0.2
1.68
100
0.8462 0
0.101 0.052 0
0.3
1.28
70
0.7873 0
0.140 0.072 0
Na 2 SO 4
0–0.3 2.55
150
0.9798 0.007 0
0
0.014
for a constant PSD. Setup B experiments generally reached steady-state after twelve
minutes or less.
We adjusted the educt concentrations and educt volume flows according to Table 1
to investigate the impact of the recycle ratio β = ˙
M circ / ˙
M mix,2 independently of
changes for S
1:1
a , R
1:1 or the energy dissipation in the CIJM. ˙
M [kg
1 s
−1
] designates
the mass flow, including liquid and solid phase, and x
L
j = M
L
j /M
L are the component
mass fractions in the liquid phase (L). Neither educt solution contains a solid phase.
Further details on this experiment are provided in [5].
2.2.2 Dynamic Experiments
We used the plant in Fig. 4 for bulk semi-batch experiments (Type C) and two-zone
experiments (Type D) to validate the equivalent circuit hypothesis for the semi-batch
model. Further information on the underlying idea of this experiment is provided in
Sect. 2.3.2.1. The plant consists of a 11-L tank reactor (1), a 6-L feed container (2),
and an external pipe-circuit (3) with a mixing reactor (4). Only a short overview on
the experimental procedure is given in this article. Further details are provided in
[29].
117
BaCl 2
Na 2 SO 4
P 2
P 1
M
S
P 3
CIJM
Product
Fig. 3 Experimental Setup B to investigate the influence of recycle streams with pumps (P), mixer
(M), splitter (S), and CIJM precipitation reactor. Flow meters for all pumps are neglected in the
figure due to reasons of visibility. Reprinted with permission from [5]
Table 1 Educt solution composition for recycle stream simulations. Reprinted with permission
from [5]
Solution β
˙
M(g/s)
Q
ml 1 min −1
x L
H2O
x L
Na
x L
Ba
x L
Cl
x L
SO4
BaCl 2
0
2.62
150
0.8921 0
0.071 0.037 0
0.1
2.24
130
0.8714 0
0.085 0.044 0
0.2
1.68
100
0.8462 0
0.101 0.052 0
0.3
1.28
70
0.7873 0
0.140 0.072 0
Na 2 SO 4
0–0.3 2.55
150
0.9798 0.007 0
0
0.014
for a constant PSD. Setup B experiments generally reached steady-state after twelve
minutes or less.
We adjusted the educt concentrations and educt volume flows according to Table 1
to investigate the impact of the recycle ratio β = ˙
M circ / ˙
M mix,2 independently of
changes for S
1:1
a , R
1:1 or the energy dissipation in the CIJM. ˙
M [kg
1 s
−1
] designates
the mass flow, including liquid and solid phase, and x
L
j = M
L
j /M
L are the component
mass fractions in the liquid phase (L). Neither educt solution contains a solid phase.
Further details on this experiment are provided in [5].
2.2.2 Dynamic Experiments
We used the plant in Fig. 4 for bulk semi-batch experiments (Type C) and two-zone
experiments (Type D) to validate the equivalent circuit hypothesis for the semi-batch
model. Further information on the underlying idea of this experiment is provided in
Sect. 2.3.2.1. The plant consists of a 11-L tank reactor (1), a 6-L feed container (2),
and an external pipe-circuit (3) with a mixing reactor (4). Only a short overview on
the experimental procedure is given in this article. Further details are provided in
[29].