

3 Dynamics of Spray Granulation in Continuously …
99
a
b
c
0.8
0.9
1
1.1
1.2
d 32 [mm]
Sauter mean diameter
product
milled
10
20
30
40
0
50
100
t 1
t 2
process time t [h]
˙
m
i [ kg
/h]
mass flows
a
b
c
unstable
stable
0.6
0 .7
0 .8
0 .9
20
40
60
80
100
μ mill [mm]
α [%]
stability map
τ2 = 10 s
τ2 = 60 s
τ2 = 300 s
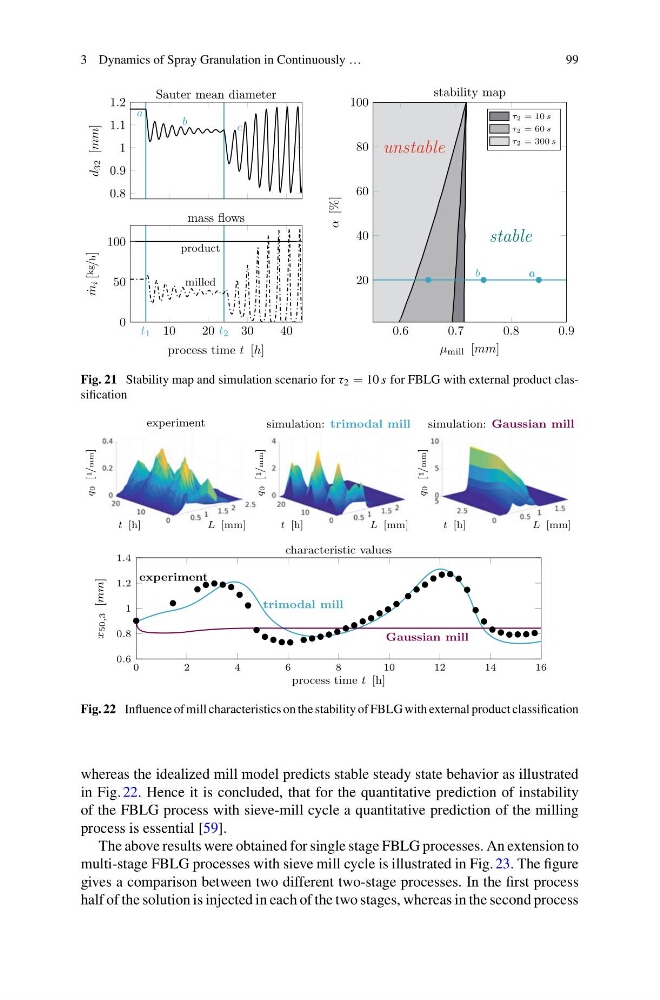
Fig. 21 Stability map and simulation scenario for τ 2 = 10 s for FBLG with external product classification
experiment
t [h]
L [mm]
q0 [ 1
/mm]
simulation: trimodal mill
t [h]
L [mm]
q0 [ 1
/mm]
simulation: Gaussian mill
t [h]
L [mm]
q0 [ 1
/mm]
0
2
4
6
8
1 0
1 2
1 4
1 6
0.6
0.8
1
1.2
1.4
experiment
trimodal mill
Gaussian mill
process time t [h]
x
50,3 [mm]
characteristic values
Fig. 22 Influence of mill characteristics on the stability of FBLG with external product classification
whereas the idealized mill model predicts stable steady state behavior as illustrated
in Fig. 22. Hence it is concluded, that for the quantitative prediction of instability
of the FBLG process with sieve-mill cycle a quantitative prediction of the milling
process is essential [59].
The above results were obtained for single stage FBLG processes. An extension to
multi-stage FBLG processes with sieve mill cycle is illustrated in Fig. 23. The figure
gives a comparison between two different two-stage processes. In the first process
half of the solution is injected in each of the two stages, whereas in the second process
99
a
b
c
0.8
0.9
1
1.1
1.2
d 32 [mm]
Sauter mean diameter
product
milled
10
20
30
40
0
50
100
t 1
t 2
process time t [h]
˙
m
i [ kg
/h]
mass flows
a
b
c
unstable
stable
0.6
0 .7
0 .8
0 .9
20
40
60
80
100
μ mill [mm]
α [%]
stability map
τ2 = 10 s
τ2 = 60 s
τ2 = 300 s
Fig. 21 Stability map and simulation scenario for τ 2 = 10 s for FBLG with external product classification
experiment
t [h]
L [mm]
q0 [ 1
/mm]
simulation: trimodal mill
t [h]
L [mm]
q0 [ 1
/mm]
simulation: Gaussian mill
t [h]
L [mm]
q0 [ 1
/mm]
0
2
4
6
8
1 0
1 2
1 4
1 6
0.6
0.8
1
1.2
1.4
experiment
trimodal mill
Gaussian mill
process time t [h]
x
50,3 [mm]
characteristic values
Fig. 22 Influence of mill characteristics on the stability of FBLG with external product classification
whereas the idealized mill model predicts stable steady state behavior as illustrated
in Fig. 22. Hence it is concluded, that for the quantitative prediction of instability
of the FBLG process with sieve-mill cycle a quantitative prediction of the milling
process is essential [59].
The above results were obtained for single stage FBLG processes. An extension to
multi-stage FBLG processes with sieve mill cycle is illustrated in Fig. 23. The figure
gives a comparison between two different two-stage processes. In the first process
half of the solution is injected in each of the two stages, whereas in the second process