

level method and the UFF was used as the low-level method. In Scheme 7, the target
atoms in SC-AFIR are indicated with an asterisk (*). The SC-AFIR algorithm can be
applied even to a system of this size by using the ONIOM method and by designating a few target atoms. The search was applied only to the local minimum structures
having the chemical bonding pattern identical to the input structure. In this system,
the chemical bonding pattern changes twice when the hydride transfers from the
position 1 in the substrate to Rh and when the hydride transfers back from Rh to the
position 3 in the substrate to generate the product. Therefore, we prepared three
inputs: one is for the reactant complex, the second one is for the intermediate state
including Rh-hydride species, and the third one is for the product complex. In these
three SC-AFIR searches, γ was set to 300 kJ/mol.
By applying the SC-AFIR algorithm to the system modeled using the ONIOM
method, we obtained a reaction path network consisting of hundreds of local
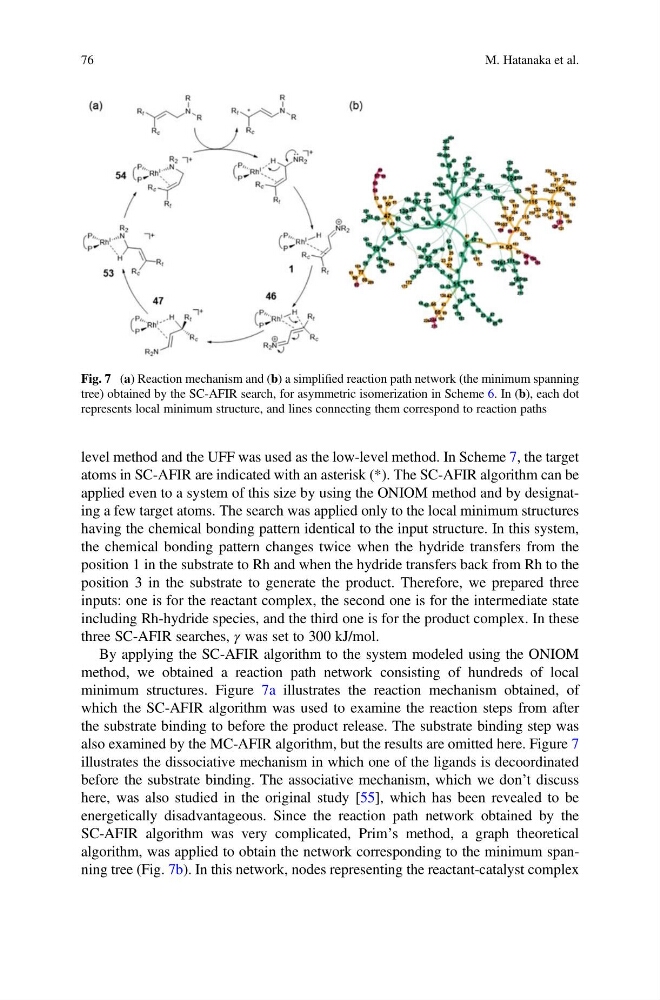
minimum structures. Figure 7a illustrates the reaction mechanism obtained, of
which the SC-AFIR algorithm was used to examine the reaction steps from after
the substrate binding to before the product release. The substrate binding step was
also examined by the MC-AFIR algorithm, but the results are omitted here. Figure 7
illustrates the dissociative mechanism in which one of the ligands is decoordinated
before the substrate binding. The associative mechanism, which we don’t discuss
here, was also studied in the original study [55], which has been revealed to be
energetically disadvantageous. Since the reaction path network obtained by the
SC-AFIR algorithm was very complicated, Prim’s method, a graph theoretical
algorithm, was applied to obtain the network corresponding to the minimum spanning tree (Fig. 7b). In this network, nodes representing the reactant-catalyst complex
Fig. 7 (a) Reaction mechanism and (b) a simplified reaction path network (the minimum spanning
tree) obtained by the SC-AFIR search, for asymmetric isomerization in Scheme 6. In (b), each dot
represents local minimum structure, and lines connecting them correspond to reaction paths
76
M. Hatanaka et al.
atoms in SC-AFIR are indicated with an asterisk (*). The SC-AFIR algorithm can be
applied even to a system of this size by using the ONIOM method and by designating a few target atoms. The search was applied only to the local minimum structures
having the chemical bonding pattern identical to the input structure. In this system,
the chemical bonding pattern changes twice when the hydride transfers from the
position 1 in the substrate to Rh and when the hydride transfers back from Rh to the
position 3 in the substrate to generate the product. Therefore, we prepared three
inputs: one is for the reactant complex, the second one is for the intermediate state
including Rh-hydride species, and the third one is for the product complex. In these
three SC-AFIR searches, γ was set to 300 kJ/mol.
By applying the SC-AFIR algorithm to the system modeled using the ONIOM
method, we obtained a reaction path network consisting of hundreds of local
minimum structures. Figure 7a illustrates the reaction mechanism obtained, of
which the SC-AFIR algorithm was used to examine the reaction steps from after
the substrate binding to before the product release. The substrate binding step was
also examined by the MC-AFIR algorithm, but the results are omitted here. Figure 7
illustrates the dissociative mechanism in which one of the ligands is decoordinated
before the substrate binding. The associative mechanism, which we don’t discuss
here, was also studied in the original study [55], which has been revealed to be
energetically disadvantageous. Since the reaction path network obtained by the
SC-AFIR algorithm was very complicated, Prim’s method, a graph theoretical
algorithm, was applied to obtain the network corresponding to the minimum spanning tree (Fig. 7b). In this network, nodes representing the reactant-catalyst complex
Fig. 7 (a) Reaction mechanism and (b) a simplified reaction path network (the minimum spanning
tree) obtained by the SC-AFIR search, for asymmetric isomerization in Scheme 6. In (b), each dot
represents local minimum structure, and lines connecting them correspond to reaction paths
76
M. Hatanaka et al.