

composition, reaction conditions, and target atoms. How this reaction mechanism
was extracted from the reaction path network is described as follows.
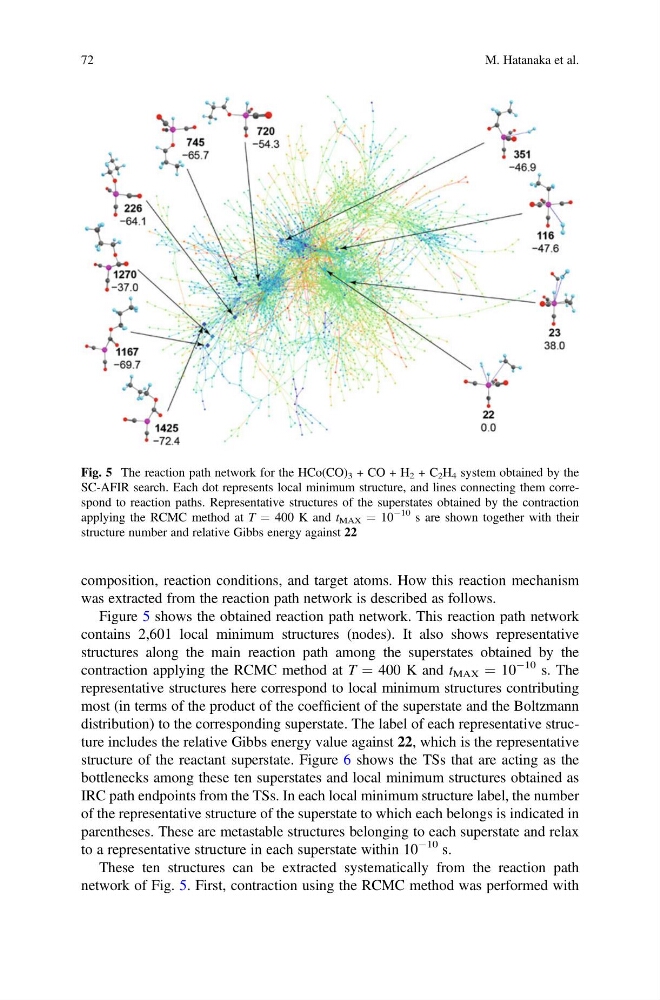
Figure 5 shows the obtained reaction path network. This reaction path network
contains 2,601 local minimum structures (nodes). It also shows representative
structures along the main reaction path among the superstates obtained by the
contraction applying the RCMC method at T ¼ 400 K and t MAX ¼ 10
À10 s. The
representative structures here correspond to local minimum structures contributing
most (in terms of the product of the coefficient of the superstate and the Boltzmann
distribution) to the corresponding superstate. The label of each representative structure includes the relative Gibbs energy value against 22, which is the representative
structure of the reactant superstate. Figure 6 shows the TSs that are acting as the
bottlenecks among these ten superstates and local minimum structures obtained as
IRC path endpoints from the TSs. In each local minimum structure label, the number
of the representative structure of the superstate to which each belongs is indicated in
parentheses. These are metastable structures belonging to each superstate and relax
to a representative structure in each superstate within 10
À10 s.
These ten structures can be extracted systematically from the reaction path
network of Fig. 5. First, contraction using the RCMC method was performed with
Fig. 5 The reaction path network for the HCo(CO) 3 + CO + H 2 + C 2 H 4 system obtained by the
SC-AFIR search. Each dot represents local minimum structure, and lines connecting them correspond to reaction paths. Representative structures of the superstates obtained by the contraction
applying the RCMC method at T ¼ 400 K and t MAX ¼ 10
À10 s are shown together with their
structure number and relative Gibbs energy against 22
72
M. Hatanaka et al.
was extracted from the reaction path network is described as follows.
Figure 5 shows the obtained reaction path network. This reaction path network
contains 2,601 local minimum structures (nodes). It also shows representative
structures along the main reaction path among the superstates obtained by the
contraction applying the RCMC method at T ¼ 400 K and t MAX ¼ 10
À10 s. The
representative structures here correspond to local minimum structures contributing
most (in terms of the product of the coefficient of the superstate and the Boltzmann
distribution) to the corresponding superstate. The label of each representative structure includes the relative Gibbs energy value against 22, which is the representative
structure of the reactant superstate. Figure 6 shows the TSs that are acting as the
bottlenecks among these ten superstates and local minimum structures obtained as
IRC path endpoints from the TSs. In each local minimum structure label, the number
of the representative structure of the superstate to which each belongs is indicated in
parentheses. These are metastable structures belonging to each superstate and relax
to a representative structure in each superstate within 10
À10 s.
These ten structures can be extracted systematically from the reaction path
network of Fig. 5. First, contraction using the RCMC method was performed with
Fig. 5 The reaction path network for the HCo(CO) 3 + CO + H 2 + C 2 H 4 system obtained by the
SC-AFIR search. Each dot represents local minimum structure, and lines connecting them correspond to reaction paths. Representative structures of the superstates obtained by the contraction
applying the RCMC method at T ¼ 400 K and t MAX ¼ 10
À10 s are shown together with their
structure number and relative Gibbs energy against 22
72
M. Hatanaka et al.