

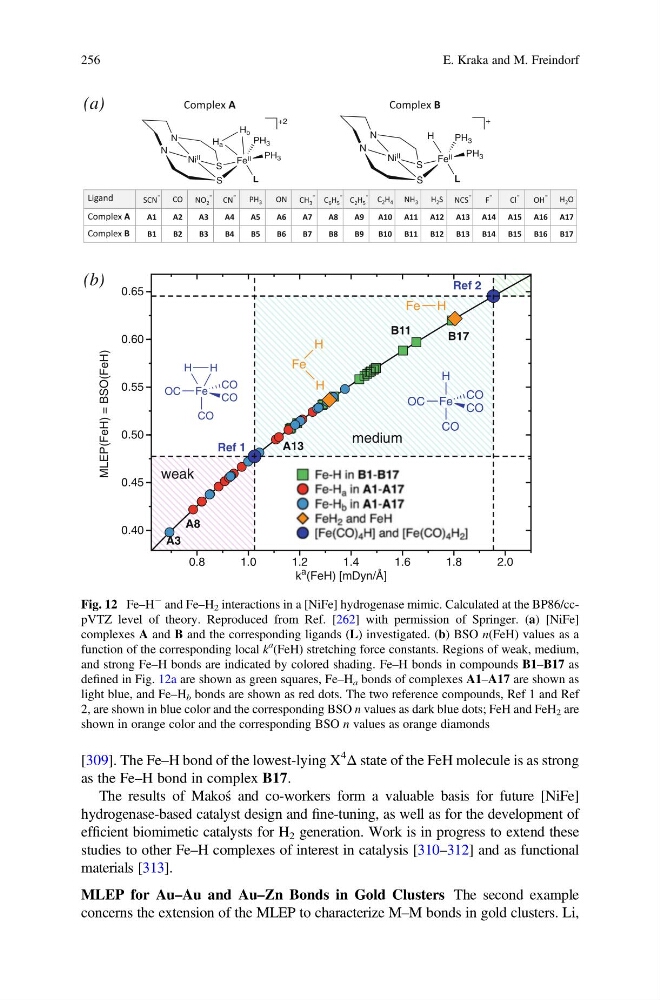
[309]. The Fe–H bond of the lowest-lying X
4
Δ state of the FeH molecule is as strong
as the Fe–H bond in complex B17.
The results of Makoś and co-workers form a valuable basis for future [NiFe]
hydrogenase-based catalyst design and fine-tuning, as well as for the development of
efficient biomimetic catalysts for H 2 generation. Work is in progress to extend these
studies to other Fe–H complexes of interest in catalysis [310–312] and as functional
materials [313].
MLEP for Au–Au and Au–Zn Bonds in Gold Clusters The second example
concerns the extension of the MLEP to characterize M–M bonds in gold clusters. Li,
N
N
Ni II
S
S
Fe II
PH 3
L
PH 3
H
+
N
N
Ni II
S
S
Fe II
PH 3
L
PH 3
H a
H b
+2
Complex B
Complex A
(a)
weak
medium
Ref 2
Fe
H
OC
CO
CO
CO
H
Fe
H
OC
CO
CO
CO
Fe
H
H
Fe H
Ref 1
A3
A8
A13
B11
B17
MLEP(FeH) = BSO(FeH)
0.40
0.45
0.50
0.55
0.60
0.65
k
a (FeH) [mDyn/Å]
0.8
1.0
1.2
1.4
1.6
1.8
2.0
(b)
Fig. 12 Fe–H
À and Fe–H 2 interactions in a [NiFe] hydrogenase mimic. Calculated at the BP86/ccpVTZ level of theory. Reproduced from Ref. [262] with permission of Springer. (a) [NiFe]
complexes A and B and the corresponding ligands (L) investigated. (b) BSO n(FeH) values as a
function of the corresponding local k
a
(FeH) stretching force constants. Regions of weak, medium,
and strong Fe–H bonds are indicated by colored shading. Fe–H bonds in compounds B1–B17 as
defined in Fig. 12a are shown as green squares, Fe–H a bonds of complexes A1–A17 are shown as
light blue, and Fe–H b bonds are shown as red dots. The two reference compounds, Ref 1 and Ref
2, are shown in blue color and the corresponding BSO n values as dark blue dots; FeH and FeH 2 are
shown in orange color and the corresponding BSO n values as orange diamonds
256
E. Kraka and M. Freindorf
4
Δ state of the FeH molecule is as strong
as the Fe–H bond in complex B17.
The results of Makoś and co-workers form a valuable basis for future [NiFe]
hydrogenase-based catalyst design and fine-tuning, as well as for the development of
efficient biomimetic catalysts for H 2 generation. Work is in progress to extend these
studies to other Fe–H complexes of interest in catalysis [310–312] and as functional
materials [313].
MLEP for Au–Au and Au–Zn Bonds in Gold Clusters The second example
concerns the extension of the MLEP to characterize M–M bonds in gold clusters. Li,
N
N
Ni II
S
S
Fe II
PH 3
L
PH 3
H
+
N
N
Ni II
S
S
Fe II
PH 3
L
PH 3
H a
H b
+2
Complex B
Complex A
(a)
weak
medium
Ref 2
Fe
H
OC
CO
CO
CO
H
Fe
H
OC
CO
CO
CO
Fe
H
H
Fe H
Ref 1
A3
A8
A13
B11
B17
MLEP(FeH) = BSO(FeH)
0.40
0.45
0.50
0.55
0.60
0.65
k
a (FeH) [mDyn/Å]
0.8
1.0
1.2
1.4
1.6
1.8
2.0
(b)
Fig. 12 Fe–H
À and Fe–H 2 interactions in a [NiFe] hydrogenase mimic. Calculated at the BP86/ccpVTZ level of theory. Reproduced from Ref. [262] with permission of Springer. (a) [NiFe]
complexes A and B and the corresponding ligands (L) investigated. (b) BSO n(FeH) values as a
function of the corresponding local k
a
(FeH) stretching force constants. Regions of weak, medium,
and strong Fe–H bonds are indicated by colored shading. Fe–H bonds in compounds B1–B17 as
defined in Fig. 12a are shown as green squares, Fe–H a bonds of complexes A1–A17 are shown as
light blue, and Fe–H b bonds are shown as red dots. The two reference compounds, Ref 1 and Ref
2, are shown in blue color and the corresponding BSO n values as dark blue dots; FeH and FeH 2 are
shown in orange color and the corresponding BSO n values as orange diamonds
256
E. Kraka and M. Freindorf