

substituents, and those with bulky substituents (sterically hindered phosphines, open
black circles). It also has to be noted that while some of the relationships shown in
Fig. 7 show the right trend, i.e., a stronger NiL bond, leads to a weaker CO bond,
others predict an increase of the CO bond strength with increasing NiL bond
strength. This contradicts Tolman’s assumption that an increase of the electron
density at the metal atom leads to increased CO π-back donation leading to an
increased population of the CO anti-bonding π-orbital and a weakening of the CO
bond that can be identified by a lower CO stretching frequency.
Overall, the scattering of data point is too large to derive any reliable mode of
prediction. The obvious success of TEP studies reported in the literature is more a
result of restricting the studies to a smaller set of chemically similar complexes
(often <20). However, the comprehensive study of Setiawan and co-workers [274]
clearly reveals that a more general application of the TEP is rather questionable,
indicating that Tolman’s bonding model is oversimplified and cannot capture the full
complexity of ML bonding as shown in Fig. 1. Therefore, this bonding model has to
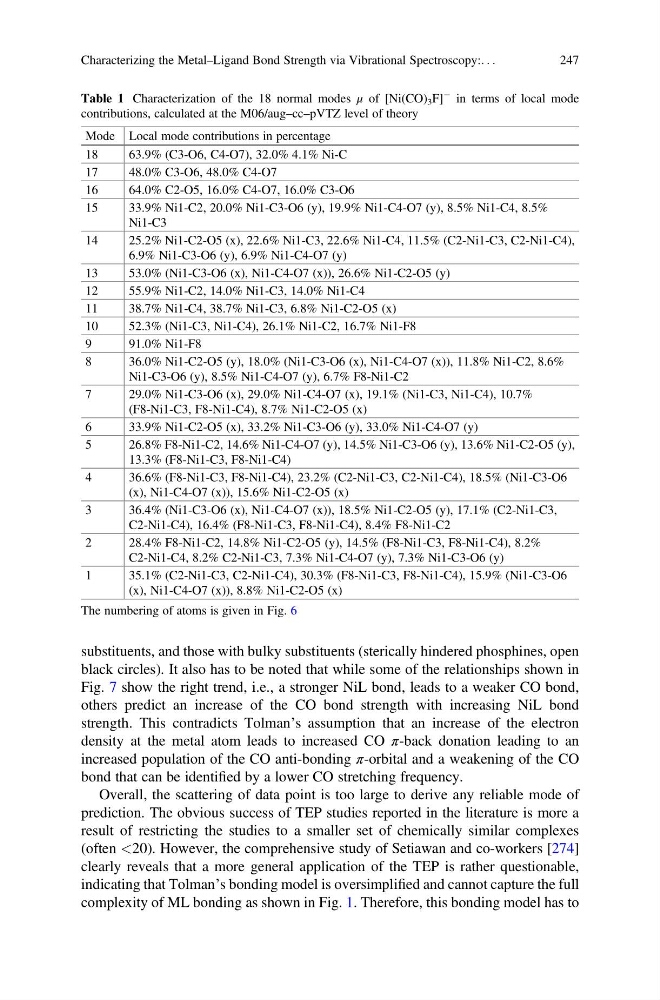
Table 1 Characterization of the 18 normal modes μ of [Ni(CO) 3 F]
À in terms of local mode
contributions, calculated at the M06/aug–cc–pVTZ level of theory
Mode Local mode contributions in percentage
18
63.9% (C3-O6, C4-O7), 32.0% 4.1% Ni-C
17
48.0% C3-O6, 48.0% C4-O7
16
64.0% C2-O5, 16.0% C4-O7, 16.0% C3-O6
15
33.9% Ni1-C2, 20.0% Ni1-C3-O6 (y), 19.9% Ni1-C4-O7 (y), 8.5% Ni1-C4, 8.5%
Ni1-C3
14
25.2% Ni1-C2-O5 (x), 22.6% Ni1-C3, 22.6% Ni1-C4, 11.5% (C2-Ni1-C3, C2-Ni1-C4),
6.9% Ni1-C3-O6 (y), 6.9% Ni1-C4-O7 (y)
13
53.0% (Ni1-C3-O6 (x), Ni1-C4-O7 (x)), 26.6% Ni1-C2-O5 (y)
12
55.9% Ni1-C2, 14.0% Ni1-C3, 14.0% Ni1-C4
11
38.7% Ni1-C4, 38.7% Ni1-C3, 6.8% Ni1-C2-O5 (x)
10
52.3% (Ni1-C3, Ni1-C4), 26.1% Ni1-C2, 16.7% Ni1-F8
9
91.0% Ni1-F8
8
36.0% Ni1-C2-O5 (y), 18.0% (Ni1-C3-O6 (x), Ni1-C4-O7 (x)), 11.8% Ni1-C2, 8.6%
Ni1-C3-O6 (y), 8.5% Ni1-C4-O7 (y), 6.7% F8-Ni1-C2
7
29.0% Ni1-C3-O6 (x), 29.0% Ni1-C4-O7 (x), 19.1% (Ni1-C3, Ni1-C4), 10.7%
(F8-Ni1-C3, F8-Ni1-C4), 8.7% Ni1-C2-O5 (x)
6
33.9% Ni1-C2-O5 (x), 33.2% Ni1-C3-O6 (y), 33.0% Ni1-C4-O7 (y)
5
26.8% F8-Ni1-C2, 14.6% Ni1-C4-O7 (y), 14.5% Ni1-C3-O6 (y), 13.6% Ni1-C2-O5 (y),
13.3% (F8-Ni1-C3, F8-Ni1-C4)
4
36.6% (F8-Ni1-C3, F8-Ni1-C4), 23.2% (C2-Ni1-C3, C2-Ni1-C4), 18.5% (Ni1-C3-O6
(x), Ni1-C4-O7 (x)), 15.6% Ni1-C2-O5 (x)
3
36.4% (Ni1-C3-O6 (x), Ni1-C4-O7 (x)), 18.5% Ni1-C2-O5 (y), 17.1% (C2-Ni1-C3,
C2-Ni1-C4), 16.4% (F8-Ni1-C3, F8-Ni1-C4), 8.4% F8-Ni1-C2
2
28.4% F8-Ni1-C2, 14.8% Ni1-C2-O5 (y), 14.5% (F8-Ni1-C3, F8-Ni1-C4), 8.2%
C2-Ni1-C4, 8.2% C2-Ni1-C3, 7.3% Ni1-C4-O7 (y), 7.3% Ni1-C3-O6 (y)
1
35.1% (C2-Ni1-C3, C2-Ni1-C4), 30.3% (F8-Ni1-C3, F8-Ni1-C4), 15.9% (Ni1-C3-O6
(x), Ni1-C4-O7 (x)), 8.8% Ni1-C2-O5 (x)
The numbering of atoms is given in Fig. 6
Characterizing the Metal–Ligand Bond Strength via Vibrational Spectroscopy:. . .
247
black circles). It also has to be noted that while some of the relationships shown in
Fig. 7 show the right trend, i.e., a stronger NiL bond, leads to a weaker CO bond,
others predict an increase of the CO bond strength with increasing NiL bond
strength. This contradicts Tolman’s assumption that an increase of the electron
density at the metal atom leads to increased CO π-back donation leading to an
increased population of the CO anti-bonding π-orbital and a weakening of the CO
bond that can be identified by a lower CO stretching frequency.
Overall, the scattering of data point is too large to derive any reliable mode of
prediction. The obvious success of TEP studies reported in the literature is more a
result of restricting the studies to a smaller set of chemically similar complexes
(often <20). However, the comprehensive study of Setiawan and co-workers [274]
clearly reveals that a more general application of the TEP is rather questionable,
indicating that Tolman’s bonding model is oversimplified and cannot capture the full
complexity of ML bonding as shown in Fig. 1. Therefore, this bonding model has to
Table 1 Characterization of the 18 normal modes μ of [Ni(CO) 3 F]
À in terms of local mode
contributions, calculated at the M06/aug–cc–pVTZ level of theory
Mode Local mode contributions in percentage
18
63.9% (C3-O6, C4-O7), 32.0% 4.1% Ni-C
17
48.0% C3-O6, 48.0% C4-O7
16
64.0% C2-O5, 16.0% C4-O7, 16.0% C3-O6
15
33.9% Ni1-C2, 20.0% Ni1-C3-O6 (y), 19.9% Ni1-C4-O7 (y), 8.5% Ni1-C4, 8.5%
Ni1-C3
14
25.2% Ni1-C2-O5 (x), 22.6% Ni1-C3, 22.6% Ni1-C4, 11.5% (C2-Ni1-C3, C2-Ni1-C4),
6.9% Ni1-C3-O6 (y), 6.9% Ni1-C4-O7 (y)
13
53.0% (Ni1-C3-O6 (x), Ni1-C4-O7 (x)), 26.6% Ni1-C2-O5 (y)
12
55.9% Ni1-C2, 14.0% Ni1-C3, 14.0% Ni1-C4
11
38.7% Ni1-C4, 38.7% Ni1-C3, 6.8% Ni1-C2-O5 (x)
10
52.3% (Ni1-C3, Ni1-C4), 26.1% Ni1-C2, 16.7% Ni1-F8
9
91.0% Ni1-F8
8
36.0% Ni1-C2-O5 (y), 18.0% (Ni1-C3-O6 (x), Ni1-C4-O7 (x)), 11.8% Ni1-C2, 8.6%
Ni1-C3-O6 (y), 8.5% Ni1-C4-O7 (y), 6.7% F8-Ni1-C2
7
29.0% Ni1-C3-O6 (x), 29.0% Ni1-C4-O7 (x), 19.1% (Ni1-C3, Ni1-C4), 10.7%
(F8-Ni1-C3, F8-Ni1-C4), 8.7% Ni1-C2-O5 (x)
6
33.9% Ni1-C2-O5 (x), 33.2% Ni1-C3-O6 (y), 33.0% Ni1-C4-O7 (y)
5
26.8% F8-Ni1-C2, 14.6% Ni1-C4-O7 (y), 14.5% Ni1-C3-O6 (y), 13.6% Ni1-C2-O5 (y),
13.3% (F8-Ni1-C3, F8-Ni1-C4)
4
36.6% (F8-Ni1-C3, F8-Ni1-C4), 23.2% (C2-Ni1-C3, C2-Ni1-C4), 18.5% (Ni1-C3-O6
(x), Ni1-C4-O7 (x)), 15.6% Ni1-C2-O5 (x)
3
36.4% (Ni1-C3-O6 (x), Ni1-C4-O7 (x)), 18.5% Ni1-C2-O5 (y), 17.1% (C2-Ni1-C3,
C2-Ni1-C4), 16.4% (F8-Ni1-C3, F8-Ni1-C4), 8.4% F8-Ni1-C2
2
28.4% F8-Ni1-C2, 14.8% Ni1-C2-O5 (y), 14.5% (F8-Ni1-C3, F8-Ni1-C4), 8.2%
C2-Ni1-C4, 8.2% C2-Ni1-C3, 7.3% Ni1-C4-O7 (y), 7.3% Ni1-C3-O6 (y)
1
35.1% (C2-Ni1-C3, C2-Ni1-C4), 30.3% (F8-Ni1-C3, F8-Ni1-C4), 15.9% (Ni1-C3-O6
(x), Ni1-C4-O7 (x)), 8.8% Ni1-C2-O5 (x)
The numbering of atoms is given in Fig. 6
Characterizing the Metal–Ligand Bond Strength via Vibrational Spectroscopy:. . .
247