

a (5,6,7)
18 (A 1 ) = TEP
16-17 (E)
F8
Ni
O5C2
C4O7
C3O6
Local mode frequencies
a
[cm
-1
]
2000
2020
2040
2060
2080
2100
2120
2140
Normal mode frequencies µ [cm -1 ]
2000
2020
2040
2060
2080
2100
2120
2140
Scaling factor
0
0.1
0.2
0.3
0.4
0.5
0.6
0.7
0.8
0.9
1.0
mass dependent
splitting
Free CO stretching:
2234 cm
-1
2019 cm
-1
2037 cm
-1
2118 cm
-1
(a)
1 2 3 4 5 6 7 8 9 10 11 12 13 14 15 16 17 18
0.0
10.0
20.0
30.0
40.0
50.0
60.0
70.0
80.0
90.0
100.0
Local Mode Character [%]
Normal Mode µ
91.0
16.7
11.8
26.1
55.9
33.9
9.5
26.2
38.7
14.0
22.6
8.5
9.5
26.2
38.7
14.0
22.6
8.5
64.0
32.0
16.0
48.0
32.0
16.0
48.0
32.0
28.4
8.4
26.8
6.7
15.2
7.3
8.2
18.3
6.6
5.3
15.2
7.3
8.2
18.3
6.6
5.3
17.5
8.2
8.5
11.6
5.7
17.5 8.2
8.5
11.6
5.7
8.8
15.6
33.9
8.7
6.8
25.2
7.9
18.2
9.2
29.0
9.0
26.5
7.9
18.2
9.2
29.0
9.0
26.5
14.8
18.5
13.6
36.0
26.6
7.3
14.5
33.2
8.6
6.9
20.0
7.3
14.6
33.0
8.5
6.9
19.9
E
4
7
E
4
7
A1
5
4
E
7
1
E
7
1
A2
2
6
0
E
3
4
0
E
3
4
0
A1
3
7
9
A1
4
1
8
E
4
4
3
E
4
4
3
A1
4
7
9
E
4
9
0
E
4
9
0
E
2
0
3
7
E
2
0
3
7
A1
2
1
1
8
Ni1-F8
Ni1-C2
Ni1-C3
Ni1-C4
C2-O5
C3-O6
C4-O7
F8-Ni1-C2
F8-Ni1-C3
F8-Ni1-C4
C2-Ni1-C3
C2-Ni1-C4
Ni1-C2-O5 (x)
Ni1-C3-O6 (x)
Ni1-C4-O7 (x)
Ni1-C2-O5 (y)
Ni1-C3-O6 (y)
Ni1-C4-O7 (y)
TEP
F8
Ni
O5C2
C4O7
C3O6
(b)
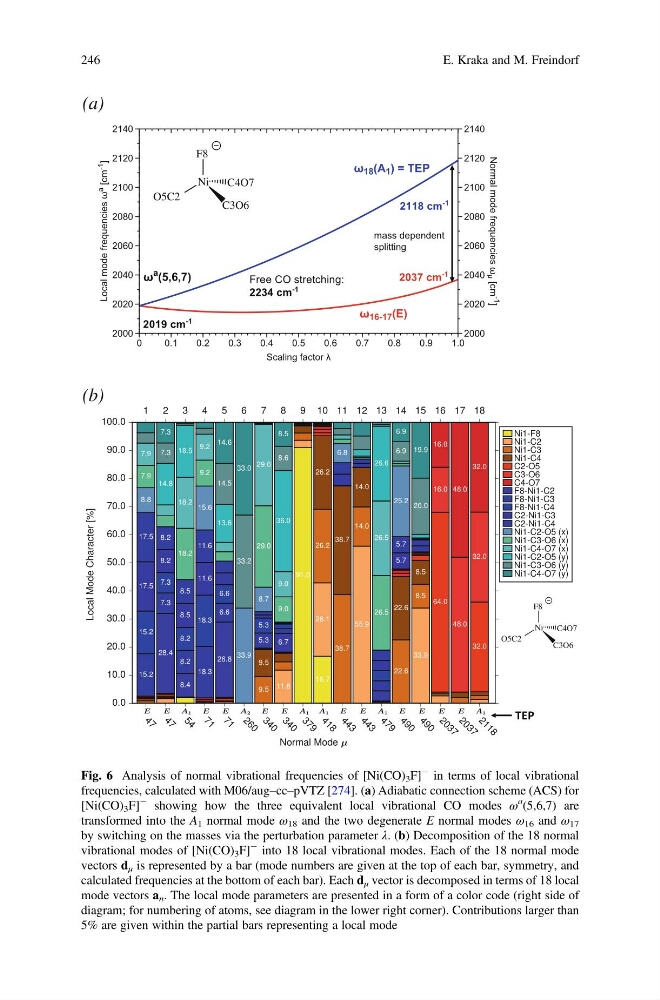
Fig. 6 Analysis of normal vibrational frequencies of [Ni(CO) 3 F]
À in terms of local vibrational
frequencies, calculated with M06/aug–cc–pVTZ [274]. (a) Adiabatic connection scheme (ACS) for
[Ni(CO) 3 F]
À showing how the three equivalent local vibrational CO modes ω
a
(5,6,7) are
transformed into the A 1 normal mode ω 18 and the two degenerate E normal modes ω 16 and ω 17
by switching on the masses via the perturbation parameter λ. (b) Decomposition of the 18 normal
vibrational modes of [Ni(CO) 3 F]
À into 18 local vibrational modes. Each of the 18 normal mode
vectors d μ is represented by a bar (mode numbers are given at the top of each bar, symmetry, and
calculated frequencies at the bottom of each bar). Each d μ vector is decomposed in terms of 18 local
mode vectors a n . The local mode parameters are presented in a form of a color code (right side of
diagram; for numbering of atoms, see diagram in the lower right corner). Contributions larger than
5% are given within the partial bars representing a local mode
246
E. Kraka and M. Freindorf
18 (A 1 ) = TEP
16-17 (E)
F8
Ni
O5C2
C4O7
C3O6
Local mode frequencies
a
[cm
-1
]
2000
2020
2040
2060
2080
2100
2120
2140
Normal mode frequencies µ [cm -1 ]
2000
2020
2040
2060
2080
2100
2120
2140
Scaling factor
0
0.1
0.2
0.3
0.4
0.5
0.6
0.7
0.8
0.9
1.0
mass dependent
splitting
Free CO stretching:
2234 cm
-1
2019 cm
-1
2037 cm
-1
2118 cm
-1
(a)
1 2 3 4 5 6 7 8 9 10 11 12 13 14 15 16 17 18
0.0
10.0
20.0
30.0
40.0
50.0
60.0
70.0
80.0
90.0
100.0
Local Mode Character [%]
Normal Mode µ
91.0
16.7
11.8
26.1
55.9
33.9
9.5
26.2
38.7
14.0
22.6
8.5
9.5
26.2
38.7
14.0
22.6
8.5
64.0
32.0
16.0
48.0
32.0
16.0
48.0
32.0
28.4
8.4
26.8
6.7
15.2
7.3
8.2
18.3
6.6
5.3
15.2
7.3
8.2
18.3
6.6
5.3
17.5
8.2
8.5
11.6
5.7
17.5 8.2
8.5
11.6
5.7
8.8
15.6
33.9
8.7
6.8
25.2
7.9
18.2
9.2
29.0
9.0
26.5
7.9
18.2
9.2
29.0
9.0
26.5
14.8
18.5
13.6
36.0
26.6
7.3
14.5
33.2
8.6
6.9
20.0
7.3
14.6
33.0
8.5
6.9
19.9
E
4
7
E
4
7
A1
5
4
E
7
1
E
7
1
A2
2
6
0
E
3
4
0
E
3
4
0
A1
3
7
9
A1
4
1
8
E
4
4
3
E
4
4
3
A1
4
7
9
E
4
9
0
E
4
9
0
E
2
0
3
7
E
2
0
3
7
A1
2
1
1
8
Ni1-F8
Ni1-C2
Ni1-C3
Ni1-C4
C2-O5
C3-O6
C4-O7
F8-Ni1-C2
F8-Ni1-C3
F8-Ni1-C4
C2-Ni1-C3
C2-Ni1-C4
Ni1-C2-O5 (x)
Ni1-C3-O6 (x)
Ni1-C4-O7 (x)
Ni1-C2-O5 (y)
Ni1-C3-O6 (y)
Ni1-C4-O7 (y)
TEP
F8
Ni
O5C2
C4O7
C3O6
(b)
Fig. 6 Analysis of normal vibrational frequencies of [Ni(CO) 3 F]
À in terms of local vibrational
frequencies, calculated with M06/aug–cc–pVTZ [274]. (a) Adiabatic connection scheme (ACS) for
[Ni(CO) 3 F]
À showing how the three equivalent local vibrational CO modes ω
a
(5,6,7) are
transformed into the A 1 normal mode ω 18 and the two degenerate E normal modes ω 16 and ω 17
by switching on the masses via the perturbation parameter λ. (b) Decomposition of the 18 normal
vibrational modes of [Ni(CO) 3 F]
À into 18 local vibrational modes. Each of the 18 normal mode
vectors d μ is represented by a bar (mode numbers are given at the top of each bar, symmetry, and
calculated frequencies at the bottom of each bar). Each d μ vector is decomposed in terms of 18 local
mode vectors a n . The local mode parameters are presented in a form of a color code (right side of
diagram; for numbering of atoms, see diagram in the lower right corner). Contributions larger than
5% are given within the partial bars representing a local mode
246
E. Kraka and M. Freindorf