

not always provide guidance enough to prevent the model to reproduce an experimental data set with two different sets of fine-tuned DFT values, DFT1 and DFT2,
that activate different pathways of the complex reaction network. Consequently,
different conclusions and predictions can be reached depending on the DFT set
chosen.
As an example, we use the comprehensive catalytic mechanism proposed by Yu
et al. [19] to explain the effects of residual water on the reactivity and regioselectivity
of tris(pentafluorophenyl)borane catalyst in the ring-opening reaction of
1,2-epoxyoctane by 2-propanol. The model proposed includes competitive binding
reactions, traditional Lewis-acid catalysis, and nonconventional water-mediated and
alcohol-mediated catalysis. Like other groups, they have followed the common
procedural approach of starting, right from the beginning, with all the mechanisms
and equations that are suspected to play some role and adjust only a reduced set of
the many independent parameters involved. Their microkinetic model consists of
130 reactions with a total of 149 independent parameters. They used 9 adjustable
parameters to influence the rate constants of 29 reactions to achieve optimal agreement between the model output and experimental kinetic data in the training set
(7 out of 21 experiments). The model was verified with the remaining 14 experiments, yielding moderate to good predictions, with some outliers. Because the
system of equations is heavily under-constrained (many parameters, few experimental constraints), such a loose modeling approach can lead, as shown in [20] for the
present case, to several pitfalls.
To avoid those pitfalls, we propose as an alternative modeling approach the
inverse strategy, that is, starting with the minimum number of reactions that can
describe the expected dominant mechanisms and adjusting all the DFT values.
Out of their 130 reactions, we selected 8 reactions (Fig. 14) as the dominant
mechanisms [20]. The rationale for the selection of the 8 steps included in Fig. 14 is
as follows. (a) We start with only the traditional Lewis acid catalytic cycles that
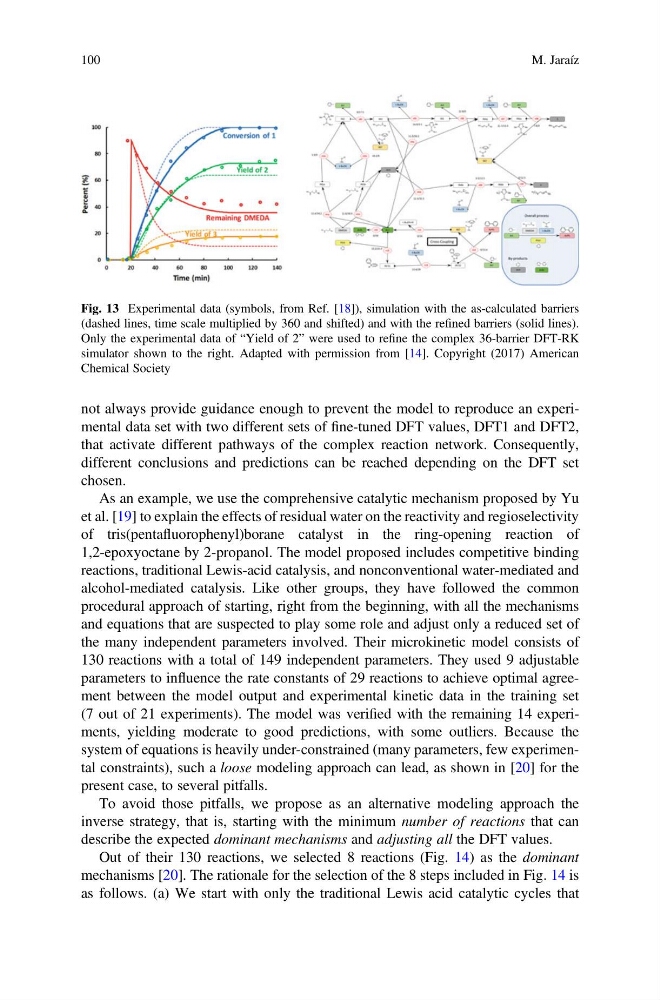
Fig. 13 Experimental data (symbols, from Ref. [18]), simulation with the as-calculated barriers
(dashed lines, time scale multiplied by 360 and shifted) and with the refined barriers (solid lines).
Only the experimental data of “Yield of 2” were used to refine the complex 36-barrier DFT-RK
simulator shown to the right. Adapted with permission from [14]. Copyright (2017) American
Chemical Society
100
M. Jaraíz
that activate different pathways of the complex reaction network. Consequently,
different conclusions and predictions can be reached depending on the DFT set
chosen.
As an example, we use the comprehensive catalytic mechanism proposed by Yu
et al. [19] to explain the effects of residual water on the reactivity and regioselectivity
of tris(pentafluorophenyl)borane catalyst in the ring-opening reaction of
1,2-epoxyoctane by 2-propanol. The model proposed includes competitive binding
reactions, traditional Lewis-acid catalysis, and nonconventional water-mediated and
alcohol-mediated catalysis. Like other groups, they have followed the common
procedural approach of starting, right from the beginning, with all the mechanisms
and equations that are suspected to play some role and adjust only a reduced set of
the many independent parameters involved. Their microkinetic model consists of
130 reactions with a total of 149 independent parameters. They used 9 adjustable
parameters to influence the rate constants of 29 reactions to achieve optimal agreement between the model output and experimental kinetic data in the training set
(7 out of 21 experiments). The model was verified with the remaining 14 experiments, yielding moderate to good predictions, with some outliers. Because the
system of equations is heavily under-constrained (many parameters, few experimental constraints), such a loose modeling approach can lead, as shown in [20] for the
present case, to several pitfalls.
To avoid those pitfalls, we propose as an alternative modeling approach the
inverse strategy, that is, starting with the minimum number of reactions that can
describe the expected dominant mechanisms and adjusting all the DFT values.
Out of their 130 reactions, we selected 8 reactions (Fig. 14) as the dominant
mechanisms [20]. The rationale for the selection of the 8 steps included in Fig. 14 is
as follows. (a) We start with only the traditional Lewis acid catalytic cycles that
Fig. 13 Experimental data (symbols, from Ref. [18]), simulation with the as-calculated barriers
(dashed lines, time scale multiplied by 360 and shifted) and with the refined barriers (solid lines).
Only the experimental data of “Yield of 2” were used to refine the complex 36-barrier DFT-RK
simulator shown to the right. Adapted with permission from [14]. Copyright (2017) American
Chemical Society
100
M. Jaraíz