

2.2 Linear Cooling Ramp Method
49
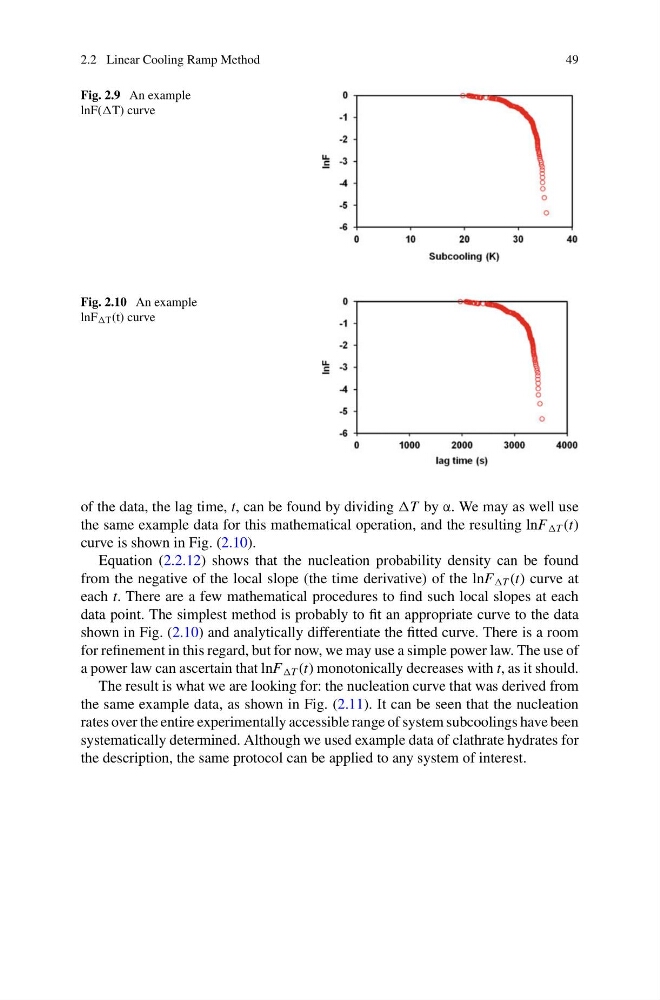
Fig. 2.9 An example
lnF(T) curve
Fig. 2.10 An example
lnF T (t) curve
of the data, the lag time, t, can be found by dividing T by α. We may as well use
the same example data for this mathematical operation, and the resulting lnF T (t)
curve is shown in Fig. (2.10).
Equation (2.2.12) shows that the nucleation probability density can be found
from the negative of the local slope (the time derivative) of the lnF T (t) curve at
each t. There are a few mathematical procedures to find such local slopes at each
data point. The simplest method is probably to fit an appropriate curve to the data
shown in Fig. (2.10) and analytically differentiate the fitted curve. There is a room
for refinement in this regard, but for now, we may use a simple power law. The use of
a power law can ascertain that lnF T (t) monotonically decreases with t, as it should.
The result is what we are looking for: the nucleation curve that was derived from
the same example data, as shown in Fig. (2.11). It can be seen that the nucleation
rates over the entire experimentally accessible range of system subcoolings have been
systematically determined. Although we used example data of clathrate hydrates for
the description, the same protocol can be applied to any system of interest.
49
Fig. 2.9 An example
lnF(T) curve
Fig. 2.10 An example
lnF T (t) curve
of the data, the lag time, t, can be found by dividing T by α. We may as well use
the same example data for this mathematical operation, and the resulting lnF T (t)
curve is shown in Fig. (2.10).
Equation (2.2.12) shows that the nucleation probability density can be found
from the negative of the local slope (the time derivative) of the lnF T (t) curve at
each t. There are a few mathematical procedures to find such local slopes at each
data point. The simplest method is probably to fit an appropriate curve to the data
shown in Fig. (2.10) and analytically differentiate the fitted curve. There is a room
for refinement in this regard, but for now, we may use a simple power law. The use of
a power law can ascertain that lnF T (t) monotonically decreases with t, as it should.
The result is what we are looking for: the nucleation curve that was derived from
the same example data, as shown in Fig. (2.11). It can be seen that the nucleation
rates over the entire experimentally accessible range of system subcoolings have been
systematically determined. Although we used example data of clathrate hydrates for
the description, the same protocol can be applied to any system of interest.