

42
2 Experimental Methods for Determination of Nucleation Rates
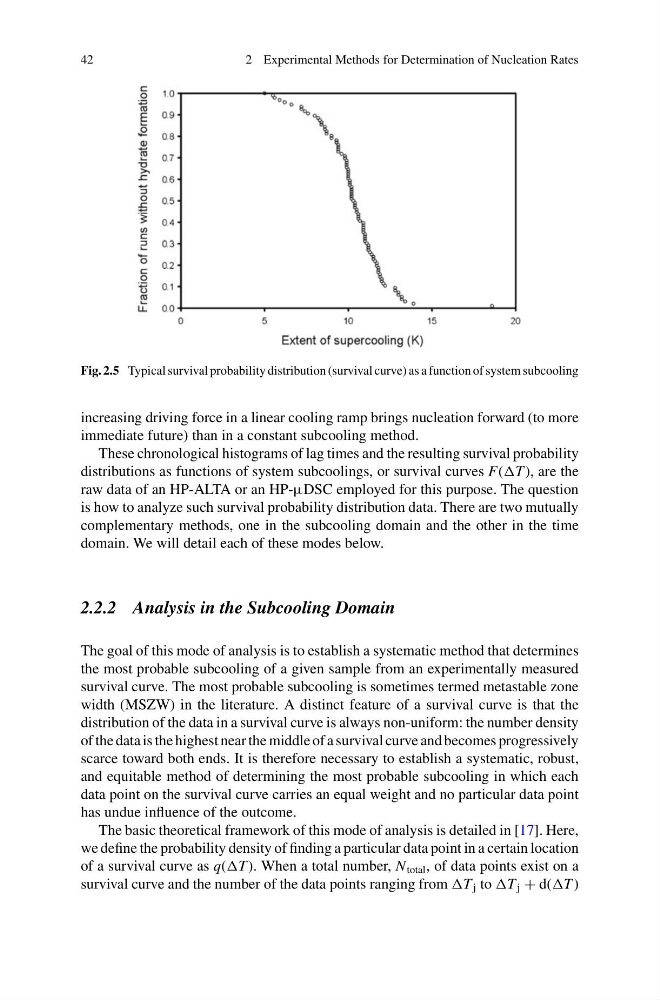
Fig. 2.5 Typical survival probability distribution (survival curve) as a function of system subcooling
increasing driving force in a linear cooling ramp brings nucleation forward (to more
immediate future) than in a constant subcooling method.
These chronological histograms of lag times and the resulting survival probability
distributions as functions of system subcoolings, or survival curves F(T ), are the
raw data of an HP-ALTA or an HP-μDSC employed for this purpose. The question
is how to analyze such survival probability distribution data. There are two mutually
complementary methods, one in the subcooling domain and the other in the time
domain. We will detail each of these modes below.
2.2.2 Analysis in the Subcooling Domain
The goal of this mode of analysis is to establish a systematic method that determines
the most probable subcooling of a given sample from an experimentally measured
survival curve. The most probable subcooling is sometimes termed metastable zone
width (MSZW) in the literature. A distinct feature of a survival curve is that the
distribution of the data in a survival curve is always non-uniform: the number density
of the data is the highest near the middle of a survival curve and becomes progressively
scarce toward both ends. It is therefore necessary to establish a systematic, robust,
and equitable method of determining the most probable subcooling in which each
data point on the survival curve carries an equal weight and no particular data point
has undue influence of the outcome.
The basic theoretical framework of this mode of analysis is detailed in [17]. Here,
we define the probability density of finding a particular data point in a certain location
of a survival curve as q(T ). When a total number, N total , of data points exist on a
survival curve and the number of the data points ranging from T j to T j + d(T )
2 Experimental Methods for Determination of Nucleation Rates
Fig. 2.5 Typical survival probability distribution (survival curve) as a function of system subcooling
increasing driving force in a linear cooling ramp brings nucleation forward (to more
immediate future) than in a constant subcooling method.
These chronological histograms of lag times and the resulting survival probability
distributions as functions of system subcoolings, or survival curves F(T ), are the
raw data of an HP-ALTA or an HP-μDSC employed for this purpose. The question
is how to analyze such survival probability distribution data. There are two mutually
complementary methods, one in the subcooling domain and the other in the time
domain. We will detail each of these modes below.
2.2.2 Analysis in the Subcooling Domain
The goal of this mode of analysis is to establish a systematic method that determines
the most probable subcooling of a given sample from an experimentally measured
survival curve. The most probable subcooling is sometimes termed metastable zone
width (MSZW) in the literature. A distinct feature of a survival curve is that the
distribution of the data in a survival curve is always non-uniform: the number density
of the data is the highest near the middle of a survival curve and becomes progressively
scarce toward both ends. It is therefore necessary to establish a systematic, robust,
and equitable method of determining the most probable subcooling in which each
data point on the survival curve carries an equal weight and no particular data point
has undue influence of the outcome.
The basic theoretical framework of this mode of analysis is detailed in [17]. Here,
we define the probability density of finding a particular data point in a certain location
of a survival curve as q(T ). When a total number, N total , of data points exist on a
survival curve and the number of the data points ranging from T j to T j + d(T )