

2.2 Linear Cooling Ramp Method
41
HP-ALTA, instruments such as high-pressure differential scanning calorimeter (HPμDSC) have been commercially available that can apply a large number of linear
cooling ramps to a given sample under a constant elevated pressure. HP-μDSC
can obtain the same type of raw data as an HP-ALTA does, with a greater utility
that enables investigations of optically opaque samples and over a greater range of
guest gas pressures. On the other hand, an HP-ALTA offers a greater flexibility in
modifications/coating of the sample cells [5, 15, 16]. Both an HP-μDSC and an HPALTA can be used for the construction of a survival curve when the cooling rate is
slow enough to eliminate thermal lags and temperature gradients within a sample.
In each setup, a small quiescent sample is cooled at a constant rate until nucleation
is effectively forcibly induced. The time and the temperature at which this event has
taken place are recorded, and the sample is subsequently heated to melt a crystal
or dissociate a clathrate hydrate. Then, the process is repeated for a large number
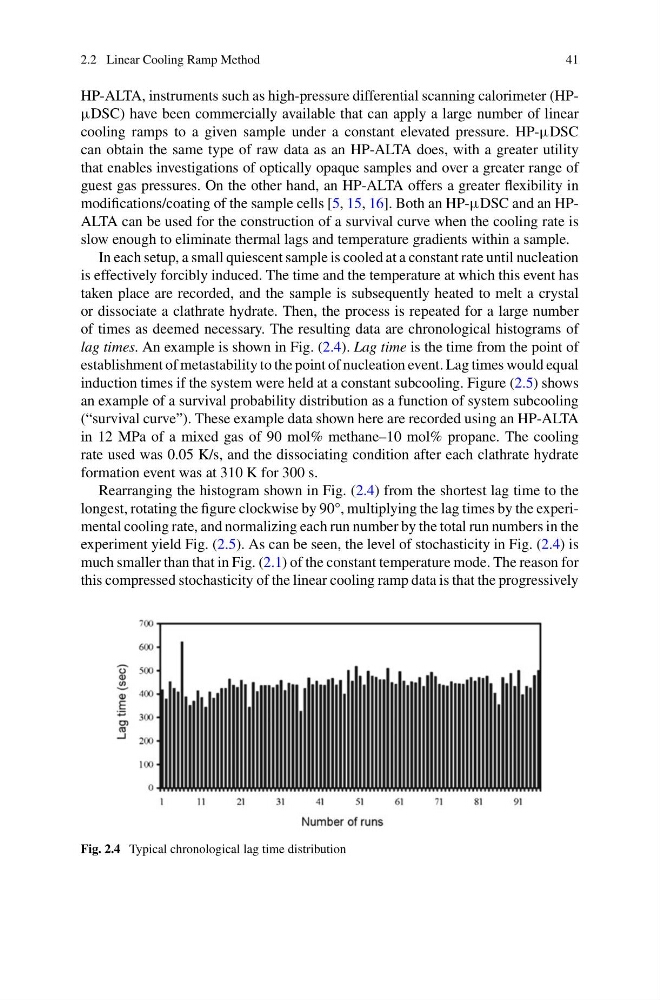
of times as deemed necessary. The resulting data are chronological histograms of
lag times. An example is shown in Fig. (2.4). Lag time is the time from the point of
establishment of metastability to the point of nucleation event. Lag times would equal
induction times if the system were held at a constant subcooling. Figure (2.5) shows
an example of a survival probability distribution as a function of system subcooling
(“survival curve”). These example data shown here are recorded using an HP-ALTA
in 12 MPa of a mixed gas of 90 mol% methane–10 mol% propane. The cooling
rate used was 0.05 K/s, and the dissociating condition after each clathrate hydrate
formation event was at 310 K for 300 s.
Rearranging the histogram shown in Fig. (2.4) from the shortest lag time to the
longest, rotating the figure clockwise by 90°, multiplying the lag times by the experimental cooling rate, and normalizing each run number by the total run numbers in the
experiment yield Fig. (2.5). As can be seen, the level of stochasticity in Fig. (2.4) is
much smaller than that in Fig. (2.1) of the constant temperature mode. The reason for
this compressed stochasticity of the linear cooling ramp data is that the progressively
Fig. 2.4 Typical chronological lag time distribution
41
HP-ALTA, instruments such as high-pressure differential scanning calorimeter (HPμDSC) have been commercially available that can apply a large number of linear
cooling ramps to a given sample under a constant elevated pressure. HP-μDSC
can obtain the same type of raw data as an HP-ALTA does, with a greater utility
that enables investigations of optically opaque samples and over a greater range of
guest gas pressures. On the other hand, an HP-ALTA offers a greater flexibility in
modifications/coating of the sample cells [5, 15, 16]. Both an HP-μDSC and an HPALTA can be used for the construction of a survival curve when the cooling rate is
slow enough to eliminate thermal lags and temperature gradients within a sample.
In each setup, a small quiescent sample is cooled at a constant rate until nucleation
is effectively forcibly induced. The time and the temperature at which this event has
taken place are recorded, and the sample is subsequently heated to melt a crystal
or dissociate a clathrate hydrate. Then, the process is repeated for a large number
of times as deemed necessary. The resulting data are chronological histograms of
lag times. An example is shown in Fig. (2.4). Lag time is the time from the point of
establishment of metastability to the point of nucleation event. Lag times would equal
induction times if the system were held at a constant subcooling. Figure (2.5) shows
an example of a survival probability distribution as a function of system subcooling
(“survival curve”). These example data shown here are recorded using an HP-ALTA
in 12 MPa of a mixed gas of 90 mol% methane–10 mol% propane. The cooling
rate used was 0.05 K/s, and the dissociating condition after each clathrate hydrate
formation event was at 310 K for 300 s.
Rearranging the histogram shown in Fig. (2.4) from the shortest lag time to the
longest, rotating the figure clockwise by 90°, multiplying the lag times by the experimental cooling rate, and normalizing each run number by the total run numbers in the
experiment yield Fig. (2.5). As can be seen, the level of stochasticity in Fig. (2.4) is
much smaller than that in Fig. (2.1) of the constant temperature mode. The reason for
this compressed stochasticity of the linear cooling ramp data is that the progressively
Fig. 2.4 Typical chronological lag time distribution