

342
Y. Shi et al.
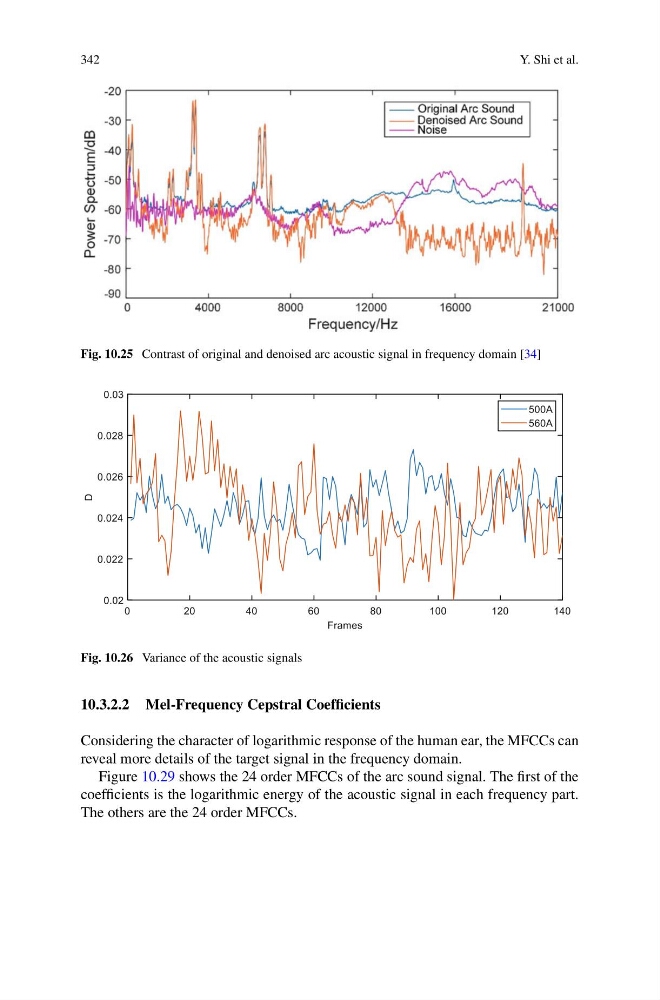
Fig. 10.25 Contrast of original and denoised arc acoustic signal in frequency domain [34]
Fig. 10.26 Variance of the acoustic signals
10.3.2.2 Mel-Frequency Cepstral Coefficients
Considering the character of logarithmic response of the human ear, the MFCCs can
reveal more details of the target signal in the frequency domain.
Figure 10.29 shows the 24 order MFCCs of the arc sound signal. The first of the
coefficients is the logarithmic energy of the acoustic signal in each frequency part.
The others are the 24 order MFCCs.
Y. Shi et al.
Fig. 10.25 Contrast of original and denoised arc acoustic signal in frequency domain [34]
Fig. 10.26 Variance of the acoustic signals
10.3.2.2 Mel-Frequency Cepstral Coefficients
Considering the character of logarithmic response of the human ear, the MFCCs can
reveal more details of the target signal in the frequency domain.
Figure 10.29 shows the 24 order MFCCs of the arc sound signal. The first of the
coefficients is the logarithmic energy of the acoustic signal in each frequency part.
The others are the 24 order MFCCs.