

7 Tubular Structures: Welding Difficulty and Potential …
247
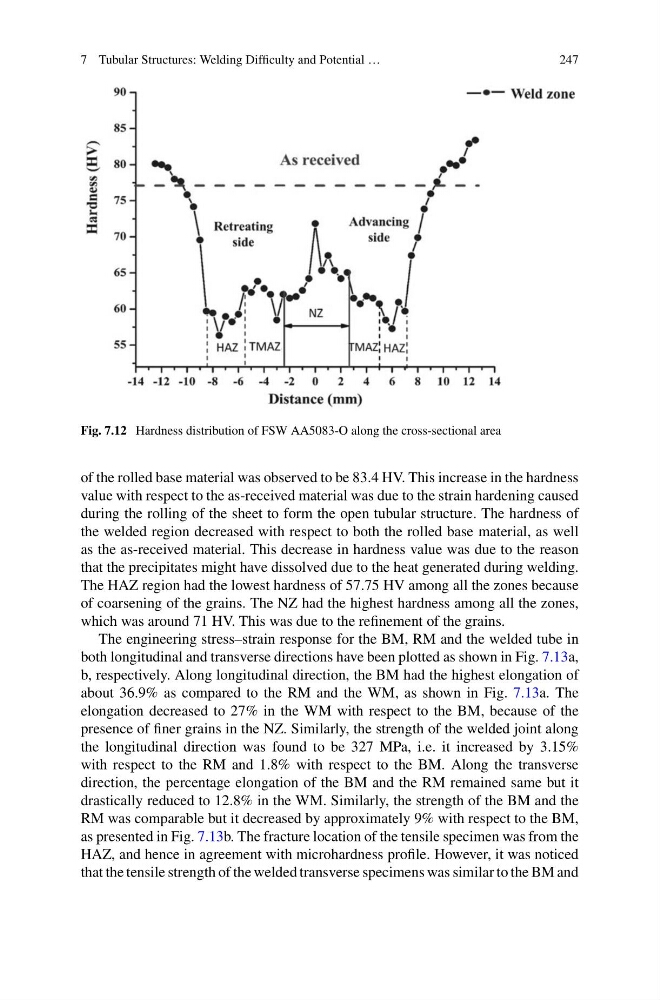
Fig. 7.12 Hardness distribution of FSW AA5083-O along the cross-sectional area
of the rolled base material was observed to be 83.4 HV. This increase in the hardness
value with respect to the as-received material was due to the strain hardening caused
during the rolling of the sheet to form the open tubular structure. The hardness of
the welded region decreased with respect to both the rolled base material, as well
as the as-received material. This decrease in hardness value was due to the reason
that the precipitates might have dissolved due to the heat generated during welding.
The HAZ region had the lowest hardness of 57.75 HV among all the zones because
of coarsening of the grains. The NZ had the highest hardness among all the zones,
which was around 71 HV. This was due to the refinement of the grains.
The engineering stress–strain response for the BM, RM and the welded tube in
both longitudinal and transverse directions have been plotted as shown in Fig. 7.13a,
b, respectively. Along longitudinal direction, the BM had the highest elongation of
about 36.9% as compared to the RM and the WM, as shown in Fig. 7.13a. The
elongation decreased to 27% in the WM with respect to the BM, because of the
presence of finer grains in the NZ. Similarly, the strength of the welded joint along
the longitudinal direction was found to be 327 MPa, i.e. it increased by 3.15%
with respect to the RM and 1.8% with respect to the BM. Along the transverse
direction, the percentage elongation of the BM and the RM remained same but it
drastically reduced to 12.8% in the WM. Similarly, the strength of the BM and the
RM was comparable but it decreased by approximately 9% with respect to the BM,
as presented in Fig. 7.13b. The fracture location of the tensile specimen was from the
HAZ, and hence in agreement with microhardness profile. However, it was noticed
that the tensile strength of the welded transverse specimens was similar to the BM and
247
Fig. 7.12 Hardness distribution of FSW AA5083-O along the cross-sectional area
of the rolled base material was observed to be 83.4 HV. This increase in the hardness
value with respect to the as-received material was due to the strain hardening caused
during the rolling of the sheet to form the open tubular structure. The hardness of
the welded region decreased with respect to both the rolled base material, as well
as the as-received material. This decrease in hardness value was due to the reason
that the precipitates might have dissolved due to the heat generated during welding.
The HAZ region had the lowest hardness of 57.75 HV among all the zones because
of coarsening of the grains. The NZ had the highest hardness among all the zones,
which was around 71 HV. This was due to the refinement of the grains.
The engineering stress–strain response for the BM, RM and the welded tube in
both longitudinal and transverse directions have been plotted as shown in Fig. 7.13a,
b, respectively. Along longitudinal direction, the BM had the highest elongation of
about 36.9% as compared to the RM and the WM, as shown in Fig. 7.13a. The
elongation decreased to 27% in the WM with respect to the BM, because of the
presence of finer grains in the NZ. Similarly, the strength of the welded joint along
the longitudinal direction was found to be 327 MPa, i.e. it increased by 3.15%
with respect to the RM and 1.8% with respect to the BM. Along the transverse
direction, the percentage elongation of the BM and the RM remained same but it
drastically reduced to 12.8% in the WM. Similarly, the strength of the BM and the
RM was comparable but it decreased by approximately 9% with respect to the BM,
as presented in Fig. 7.13b. The fracture location of the tensile specimen was from the
HAZ, and hence in agreement with microhardness profile. However, it was noticed
that the tensile strength of the welded transverse specimens was similar to the BM and