

124
N. Bhardwaj et al.
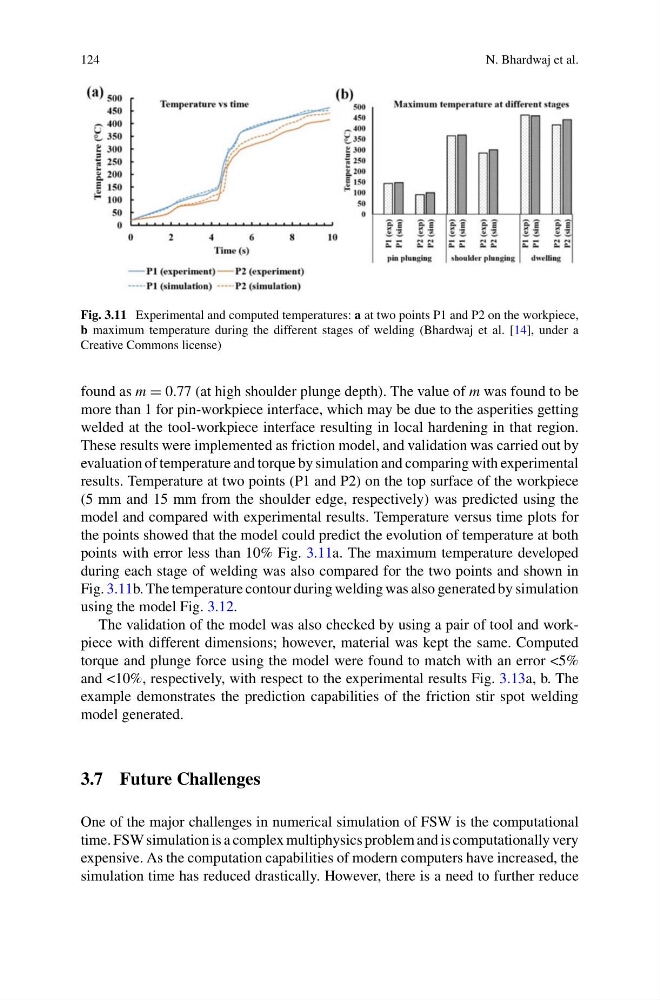
Fig. 3.11 Experimental and computed temperatures: a at two points P1 and P2 on the workpiece,
b maximum temperature during the different stages of welding (Bhardwaj et al. [14], under a
Creative Commons license)
found as m = 0.77 (at high shoulder plunge depth). The value of m was found to be
more than 1 for pin-workpiece interface, which may be due to the asperities getting
welded at the tool-workpiece interface resulting in local hardening in that region.
These results were implemented as friction model, and validation was carried out by
evaluation of temperature and torque by simulation and comparing with experimental
results. Temperature at two points (P1 and P2) on the top surface of the workpiece
(5 mm and 15 mm from the shoulder edge, respectively) was predicted using the
model and compared with experimental results. Temperature versus time plots for
the points showed that the model could predict the evolution of temperature at both
points with error less than 10% Fig. 3.11a. The maximum temperature developed
during each stage of welding was also compared for the two points and shown in
Fig. 3.11b. The temperature contour during welding was also generated by simulation
using the model Fig. 3.12.
The validation of the model was also checked by using a pair of tool and workpiece with different dimensions; however, material was kept the same. Computed
torque and plunge force using the model were found to match with an error <5%
and <10%, respectively, with respect to the experimental results Fig. 3.13a, b. The
example demonstrates the prediction capabilities of the friction stir spot welding
model generated.
3.7 Future Challenges
One of the major challenges in numerical simulation of FSW is the computational
time. FSW simulation is a complex multiphysics problem and is computationally very
expensive. As the computation capabilities of modern computers have increased, the
simulation time has reduced drastically. However, there is a need to further reduce
N. Bhardwaj et al.
Fig. 3.11 Experimental and computed temperatures: a at two points P1 and P2 on the workpiece,
b maximum temperature during the different stages of welding (Bhardwaj et al. [14], under a
Creative Commons license)
found as m = 0.77 (at high shoulder plunge depth). The value of m was found to be
more than 1 for pin-workpiece interface, which may be due to the asperities getting
welded at the tool-workpiece interface resulting in local hardening in that region.
These results were implemented as friction model, and validation was carried out by
evaluation of temperature and torque by simulation and comparing with experimental
results. Temperature at two points (P1 and P2) on the top surface of the workpiece
(5 mm and 15 mm from the shoulder edge, respectively) was predicted using the
model and compared with experimental results. Temperature versus time plots for
the points showed that the model could predict the evolution of temperature at both
points with error less than 10% Fig. 3.11a. The maximum temperature developed
during each stage of welding was also compared for the two points and shown in
Fig. 3.11b. The temperature contour during welding was also generated by simulation
using the model Fig. 3.12.
The validation of the model was also checked by using a pair of tool and workpiece with different dimensions; however, material was kept the same. Computed
torque and plunge force using the model were found to match with an error <5%
and <10%, respectively, with respect to the experimental results Fig. 3.13a, b. The
example demonstrates the prediction capabilities of the friction stir spot welding
model generated.
3.7 Future Challenges
One of the major challenges in numerical simulation of FSW is the computational
time. FSW simulation is a complex multiphysics problem and is computationally very
expensive. As the computation capabilities of modern computers have increased, the
simulation time has reduced drastically. However, there is a need to further reduce