

spreading of the plasma along the flux tubes by a toroidally and poloidally localized
gas puff was modeled. This problem involves no self-adjusting of the magnetic field,
so comparing the code results with the experiment is easier. The D 2 gas was injected
locally at the inner mid-plane and the C
2+ ion flow velocities were measured from the
Doppler shift of the emission lines around the gas injection location. The flow
pattern was found to form a 3D structure aligned with the magnetic flux tubes,
indicating an acceleration of C
2+ ions by friction with the D
+ ions spreading along
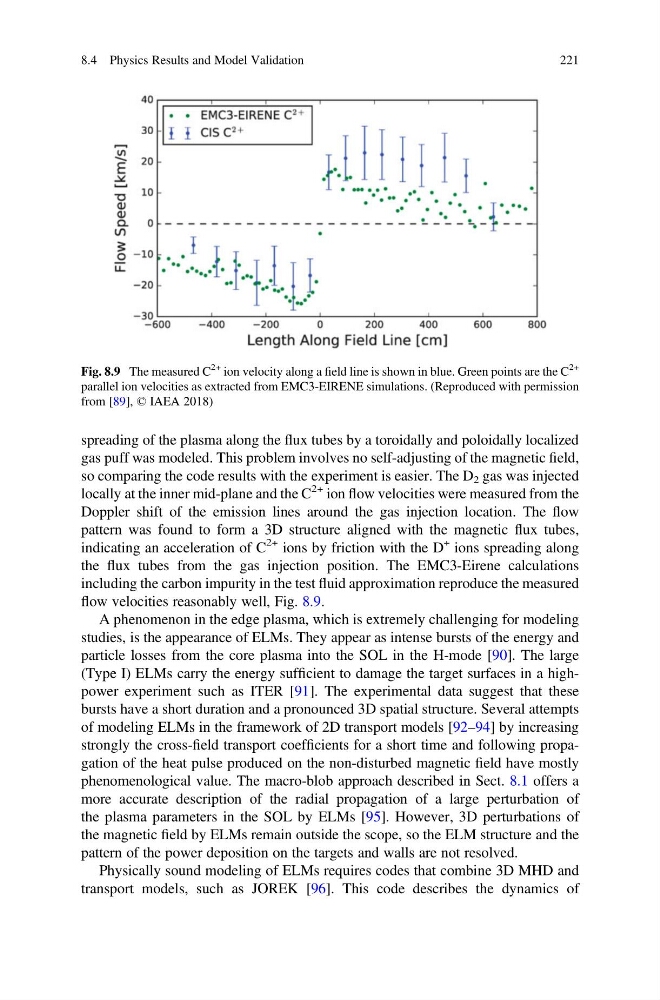
the flux tubes from the gas injection position. The EMC3-Eirene calculations
including the carbon impurity in the test fluid approximation reproduce the measured
flow velocities reasonably well, Fig. 8.9.
A phenomenon in the edge plasma, which is extremely challenging for modeling
studies, is the appearance of ELMs. They appear as intense bursts of the energy and
particle losses from the core plasma into the SOL in the H-mode [90]. The large
(Type I) ELMs carry the energy sufficient to damage the target surfaces in a highpower experiment such as ITER [91]. The experimental data suggest that these
bursts have a short duration and a pronounced 3D spatial structure. Several attempts
of modeling ELMs in the framework of 2D transport models [92–94] by increasing
strongly the cross-field transport coefficients for a short time and following propagation of the heat pulse produced on the non-disturbed magnetic field have mostly
phenomenological value. The macro-blob approach described in Sect. 8.1 offers a
more accurate description of the radial propagation of a large perturbation of
the plasma parameters in the SOL by ELMs [95]. However, 3D perturbations of
the magnetic field by ELMs remain outside the scope, so the ELM structure and the
pattern of the power deposition on the targets and walls are not resolved.
Physically sound modeling of ELMs requires codes that combine 3D MHD and
transport models, such as JOREK [96]. This code describes the dynamics of
Fig. 8.9 The measured C
2+ ion velocity along a field line is shown in blue. Green points are the C
2+
parallel ion velocities as extracted from EMC3-EIRENE simulations. (Reproduced with permission
from [89], © IAEA 2018)
8.4 Physics Results and Model Validation
221
gas puff was modeled. This problem involves no self-adjusting of the magnetic field,
so comparing the code results with the experiment is easier. The D 2 gas was injected
locally at the inner mid-plane and the C
2+ ion flow velocities were measured from the
Doppler shift of the emission lines around the gas injection location. The flow
pattern was found to form a 3D structure aligned with the magnetic flux tubes,
indicating an acceleration of C
2+ ions by friction with the D
+ ions spreading along
the flux tubes from the gas injection position. The EMC3-Eirene calculations
including the carbon impurity in the test fluid approximation reproduce the measured
flow velocities reasonably well, Fig. 8.9.
A phenomenon in the edge plasma, which is extremely challenging for modeling
studies, is the appearance of ELMs. They appear as intense bursts of the energy and
particle losses from the core plasma into the SOL in the H-mode [90]. The large
(Type I) ELMs carry the energy sufficient to damage the target surfaces in a highpower experiment such as ITER [91]. The experimental data suggest that these
bursts have a short duration and a pronounced 3D spatial structure. Several attempts
of modeling ELMs in the framework of 2D transport models [92–94] by increasing
strongly the cross-field transport coefficients for a short time and following propagation of the heat pulse produced on the non-disturbed magnetic field have mostly
phenomenological value. The macro-blob approach described in Sect. 8.1 offers a
more accurate description of the radial propagation of a large perturbation of
the plasma parameters in the SOL by ELMs [95]. However, 3D perturbations of
the magnetic field by ELMs remain outside the scope, so the ELM structure and the
pattern of the power deposition on the targets and walls are not resolved.
Physically sound modeling of ELMs requires codes that combine 3D MHD and
transport models, such as JOREK [96]. This code describes the dynamics of
Fig. 8.9 The measured C
2+ ion velocity along a field line is shown in blue. Green points are the C
2+
parallel ion velocities as extracted from EMC3-EIRENE simulations. (Reproduced with permission
from [89], © IAEA 2018)
8.4 Physics Results and Model Validation
221