

the “model validation” studies (see also [15, 21, 75, 78]). Looking at the diffusivities
required in the far SOL, one finds that they are often significantly higher than the
Bohm diffusivity. For example, the value of ~30 m
2 /s for χ e (Fig. 8.5) corresponds to
the Bohm diffusivity at ~900 eV – the value that can hardly be expected in the far
SOL. Since the Bohm expression is seen as the upper limit of the diffusivity driven
by electrostatic turbulence, see Chap. 7, one can conclude that radial plasma
transport in the far SOL is dominated by some processes related to perturbation of
the magnetic field or by outward convective transport there [29]. Since this convective flow is formed by filaments (hot plasma formations aligned with the magnetic
field and traveling radially through the SOL), it is intermittent [26–28, 75] and its
inclusion into the 2D transport codes is not straightforward, see Sect. 8.1.3. It is
sometimes emulated as an outward pinch – a convective velocity imposed on the top
of diffusion transport in the Eq. (8.1) [21, 30].
In the last decade, a considerable effort has been made to model the radial electric
field E r in the plasma edge using 2D transport codes (mostly, the SOLPS family)
with drifts and currents. In the code, E r is calculated from the electrostatic potential,
whose distribution is found from Eq. (6.52). In particular, the significant difference
in the E r values between the L and H modes is reproduced well by the code, thus
indicating the neoclassical (drift-related) nature of this field in the H-mode, Fig. 8.7.
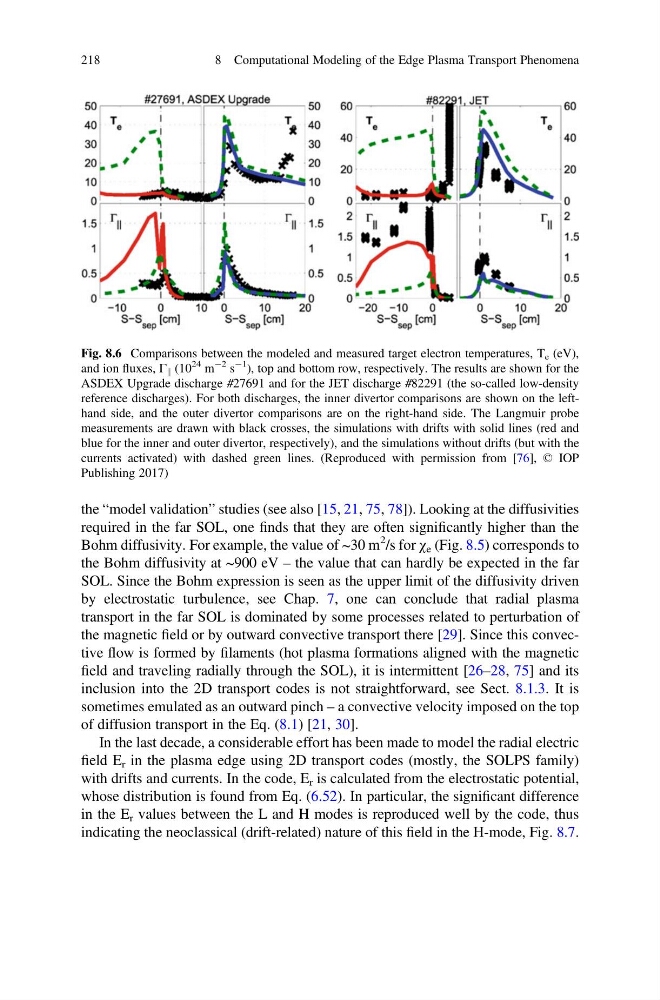
Fig. 8.6 Comparisons between the modeled and measured target electron temperatures, T e (eV),
and ion fluxes, Γ k (10
24 m
À2 s
À1
), top and bottom row, respectively. The results are shown for the
ASDEX Upgrade discharge #27691 and for the JET discharge #82291 (the so-called low-density
reference discharges). For both discharges, the inner divertor comparisons are shown on the lefthand side, and the outer divertor comparisons are on the right-hand side. The Langmuir probe
measurements are drawn with black crosses, the simulations with drifts with solid lines (red and
blue for the inner and outer divertor, respectively), and the simulations without drifts (but with the
currents activated) with dashed green lines. (Reproduced with permission from [76], © IOP
Publishing 2017)
218
8 Computational Modeling of the Edge Plasma Transport Phenomena
required in the far SOL, one finds that they are often significantly higher than the
Bohm diffusivity. For example, the value of ~30 m
2 /s for χ e (Fig. 8.5) corresponds to
the Bohm diffusivity at ~900 eV – the value that can hardly be expected in the far
SOL. Since the Bohm expression is seen as the upper limit of the diffusivity driven
by electrostatic turbulence, see Chap. 7, one can conclude that radial plasma
transport in the far SOL is dominated by some processes related to perturbation of
the magnetic field or by outward convective transport there [29]. Since this convective flow is formed by filaments (hot plasma formations aligned with the magnetic
field and traveling radially through the SOL), it is intermittent [26–28, 75] and its
inclusion into the 2D transport codes is not straightforward, see Sect. 8.1.3. It is
sometimes emulated as an outward pinch – a convective velocity imposed on the top
of diffusion transport in the Eq. (8.1) [21, 30].
In the last decade, a considerable effort has been made to model the radial electric
field E r in the plasma edge using 2D transport codes (mostly, the SOLPS family)
with drifts and currents. In the code, E r is calculated from the electrostatic potential,
whose distribution is found from Eq. (6.52). In particular, the significant difference
in the E r values between the L and H modes is reproduced well by the code, thus
indicating the neoclassical (drift-related) nature of this field in the H-mode, Fig. 8.7.
Fig. 8.6 Comparisons between the modeled and measured target electron temperatures, T e (eV),
and ion fluxes, Γ k (10
24 m
À2 s
À1
), top and bottom row, respectively. The results are shown for the
ASDEX Upgrade discharge #27691 and for the JET discharge #82291 (the so-called low-density
reference discharges). For both discharges, the inner divertor comparisons are shown on the lefthand side, and the outer divertor comparisons are on the right-hand side. The Langmuir probe
measurements are drawn with black crosses, the simulations with drifts with solid lines (red and
blue for the inner and outer divertor, respectively), and the simulations without drifts (but with the
currents activated) with dashed green lines. (Reproduced with permission from [76], © IOP
Publishing 2017)
218
8 Computational Modeling of the Edge Plasma Transport Phenomena