

upstream density – that is, both divertors start to detach simultaneously, whereas in
the experiment, the inner one detaches first. This model does also not reproduce the
high density in the far SOL at the inner target (Fig. 8.4a), seen on different machines.
Only simultaneous activation of all the drifts and currents, variable cross-field
transport and detailed simulation of impurity transport in the multi-fluid code [21]
allowed one to see this effect in modeling.
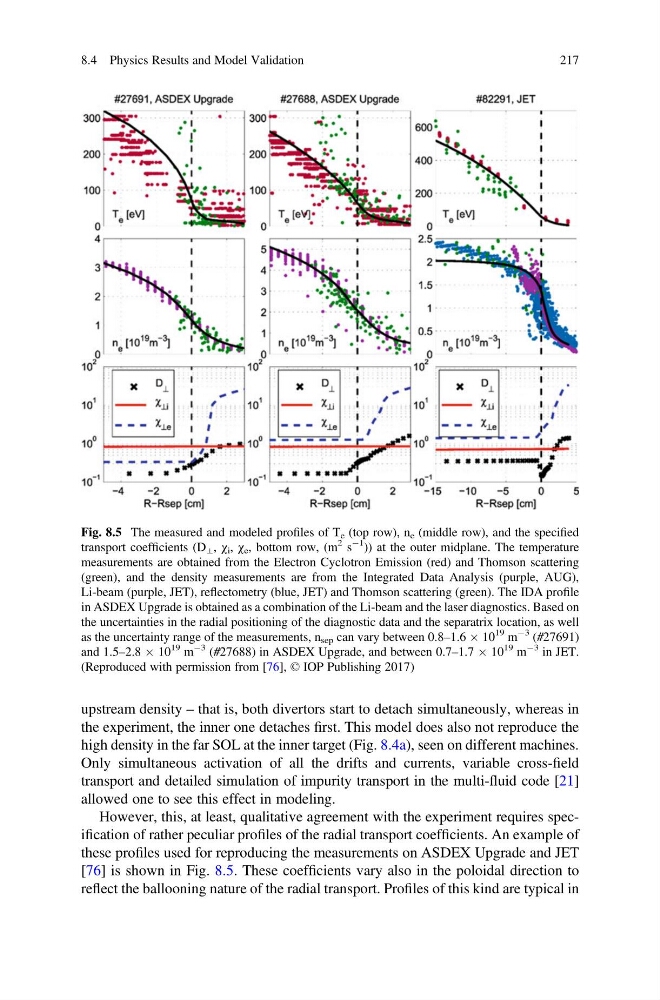
However, this, at least, qualitative agreement with the experiment requires specification of rather peculiar profiles of the radial transport coefficients. An example of
these profiles used for reproducing the measurements on ASDEX Upgrade and JET
[76] is shown in Fig. 8.5. These coefficients vary also in the poloidal direction to
reflect the ballooning nature of the radial transport. Profiles of this kind are typical in
Fig. 8.5 The measured and modeled profiles of T e (top row), n e (middle row), and the specified
transport coefficients (D ⊥ , χ i , χ e , bottom row, (m
2 s
À1
)) at the outer midplane. The temperature
measurements are obtained from the Electron Cyclotron Emission (red) and Thomson scattering
(green), and the density measurements are from the Integrated Data Analysis (purple, AUG),
Li-beam (purple, JET), reflectometry (blue, JET) and Thomson scattering (green). The IDA profile
in ASDEX Upgrade is obtained as a combination of the Li-beam and the laser diagnostics. Based on
the uncertainties in the radial positioning of the diagnostic data and the separatrix location, as well
as the uncertainty range of the measurements, n sep can vary between 0.8–1.6 Â 10
19 m
À3 (#27691)
and 1.5–2.8 Â 10
19 m
À3 (#27688) in ASDEX Upgrade, and between 0.7–1.7 Â 10
19 m
À3 in JET.
(Reproduced with permission from [76], © IOP Publishing 2017)
8.4 Physics Results and Model Validation
217
the experiment, the inner one detaches first. This model does also not reproduce the
high density in the far SOL at the inner target (Fig. 8.4a), seen on different machines.
Only simultaneous activation of all the drifts and currents, variable cross-field
transport and detailed simulation of impurity transport in the multi-fluid code [21]
allowed one to see this effect in modeling.
However, this, at least, qualitative agreement with the experiment requires specification of rather peculiar profiles of the radial transport coefficients. An example of
these profiles used for reproducing the measurements on ASDEX Upgrade and JET
[76] is shown in Fig. 8.5. These coefficients vary also in the poloidal direction to
reflect the ballooning nature of the radial transport. Profiles of this kind are typical in
Fig. 8.5 The measured and modeled profiles of T e (top row), n e (middle row), and the specified
transport coefficients (D ⊥ , χ i , χ e , bottom row, (m
2 s
À1
)) at the outer midplane. The temperature
measurements are obtained from the Electron Cyclotron Emission (red) and Thomson scattering
(green), and the density measurements are from the Integrated Data Analysis (purple, AUG),
Li-beam (purple, JET), reflectometry (blue, JET) and Thomson scattering (green). The IDA profile
in ASDEX Upgrade is obtained as a combination of the Li-beam and the laser diagnostics. Based on
the uncertainties in the radial positioning of the diagnostic data and the separatrix location, as well
as the uncertainty range of the measurements, n sep can vary between 0.8–1.6 Â 10
19 m
À3 (#27691)
and 1.5–2.8 Â 10
19 m
À3 (#27688) in ASDEX Upgrade, and between 0.7–1.7 Â 10
19 m
À3 in JET.
(Reproduced with permission from [76], © IOP Publishing 2017)
8.4 Physics Results and Model Validation
217