

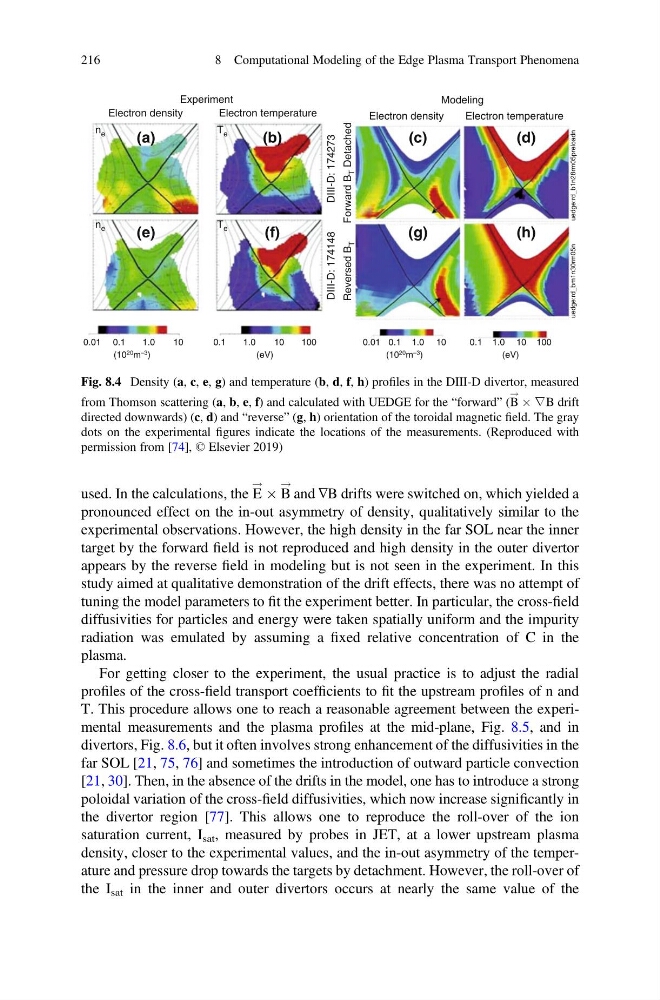
used. In the calculations, the E
! Â B
!
and ∇B drifts were switched on, which yielded a
pronounced effect on the in-out asymmetry of density, qualitatively similar to the
experimental observations. However, the high density in the far SOL near the inner
target by the forward field is not reproduced and high density in the outer divertor
appears by the reverse field in modeling but is not seen in the experiment. In this
study aimed at qualitative demonstration of the drift effects, there was no attempt of
tuning the model parameters to fit the experiment better. In particular, the cross-field
diffusivities for particles and energy were taken spatially uniform and the impurity
radiation was emulated by assuming a fixed relative concentration of C in the
plasma.
For getting closer to the experiment, the usual practice is to adjust the radial
profiles of the cross-field transport coefficients to fit the upstream profiles of n and
T. This procedure allows one to reach a reasonable agreement between the experimental measurements and the plasma profiles at the mid-plane, Fig. 8.5, and in
divertors, Fig. 8.6, but it often involves strong enhancement of the diffusivities in the
far SOL [21, 75, 76] and sometimes the introduction of outward particle convection
[21, 30]. Then, in the absence of the drifts in the model, one has to introduce a strong
poloidal variation of the cross-field diffusivities, which now increase significantly in
the divertor region [77]. This allows one to reproduce the roll-over of the ion
saturation current, I sat , measured by probes in JET, at a lower upstream plasma
density, closer to the experimental values, and the in-out asymmetry of the temperature and pressure drop towards the targets by detachment. However, the roll-over of
the I sat in the inner and outer divertors occurs at nearly the same value of the
(10 20 m –3 )
0.01 0.1
1.0
10
(eV)
0.1
1.0
10
100
(10 20 m –3 )
0.01 0.1 1.0 10
(eV)
Modeling
(a)
Electron density
Electron density
n e
n e
T e
T e
Experiment
Reversed B
T
Forward B
T Detached
DIII-D: 174148
DIII-D: 174273
Electron temperature
Electron temperature
0.1 1.0 10 100
(b)
(e)
(f)
(c)
(d)
(g)
(h)
uedge:rd_bm1n30rm05n
uedge:rd_b1n28rm05preloadn
Fig. 8.4 Density (a, c, e, g) and temperature (b, d, f, h) profiles in the DIII-D divertor, measured
from Thomson scattering (a, b, e, f) and calculated with UEDGE for the “forward” (B
! Â ∇B drift
directed downwards) (c, d) and “reverse” (g, h) orientation of the toroidal magnetic field. The gray
dots on the experimental figures indicate the locations of the measurements. (Reproduced with
permission from [74], © Elsevier 2019)
216
8 Computational Modeling of the Edge Plasma Transport Phenomena
! Â B
!
and ∇B drifts were switched on, which yielded a
pronounced effect on the in-out asymmetry of density, qualitatively similar to the
experimental observations. However, the high density in the far SOL near the inner
target by the forward field is not reproduced and high density in the outer divertor
appears by the reverse field in modeling but is not seen in the experiment. In this
study aimed at qualitative demonstration of the drift effects, there was no attempt of
tuning the model parameters to fit the experiment better. In particular, the cross-field
diffusivities for particles and energy were taken spatially uniform and the impurity
radiation was emulated by assuming a fixed relative concentration of C in the
plasma.
For getting closer to the experiment, the usual practice is to adjust the radial
profiles of the cross-field transport coefficients to fit the upstream profiles of n and
T. This procedure allows one to reach a reasonable agreement between the experimental measurements and the plasma profiles at the mid-plane, Fig. 8.5, and in
divertors, Fig. 8.6, but it often involves strong enhancement of the diffusivities in the
far SOL [21, 75, 76] and sometimes the introduction of outward particle convection
[21, 30]. Then, in the absence of the drifts in the model, one has to introduce a strong
poloidal variation of the cross-field diffusivities, which now increase significantly in
the divertor region [77]. This allows one to reproduce the roll-over of the ion
saturation current, I sat , measured by probes in JET, at a lower upstream plasma
density, closer to the experimental values, and the in-out asymmetry of the temperature and pressure drop towards the targets by detachment. However, the roll-over of
the I sat in the inner and outer divertors occurs at nearly the same value of the
(10 20 m –3 )
0.01 0.1
1.0
10
(eV)
0.1
1.0
10
100
(10 20 m –3 )
0.01 0.1 1.0 10
(eV)
Modeling
(a)
Electron density
Electron density
n e
n e
T e
T e
Experiment
Reversed B
T
Forward B
T Detached
DIII-D: 174148
DIII-D: 174273
Electron temperature
Electron temperature
0.1 1.0 10 100
(b)
(e)
(f)
(c)
(d)
(g)
(h)
uedge:rd_bm1n30rm05n
uedge:rd_b1n28rm05preloadn
Fig. 8.4 Density (a, c, e, g) and temperature (b, d, f, h) profiles in the DIII-D divertor, measured
from Thomson scattering (a, b, e, f) and calculated with UEDGE for the “forward” (B
! Â ∇B drift
directed downwards) (c, d) and “reverse” (g, h) orientation of the toroidal magnetic field. The gray
dots on the experimental figures indicate the locations of the measurements. (Reproduced with
permission from [74], © Elsevier 2019)
216
8 Computational Modeling of the Edge Plasma Transport Phenomena