

the simple reflection coefficients used in other codes (e.g. in DUSTT) and, therefore,
is better suitable for the study of dust mobilization from the material surfaces. All of
these codes were developed for dust studies in tokamaks and, therefore, assume the
toroidal symmetry of the plasma parameters. However, the DUSTT code has been
modified recently and is now used for the study of dust dynamics in the helical
device LHD [51]. The plasma parameters used in all of these codes focused on dust
dynamics studies come either from experimental measurements or, in most cases,
from 2D edge plasma transport codes (e.g. see [86]) such as UEDGE [87], different
versions of the SOLPS code (e.g. see [88] and the references therein), and some
others.
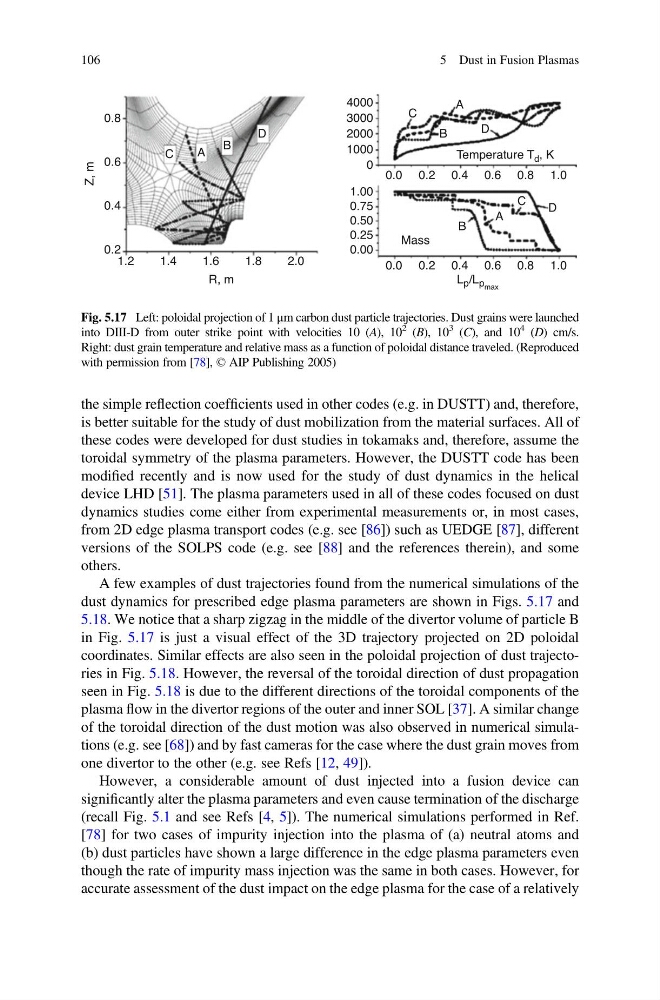
A few examples of dust trajectories found from the numerical simulations of the
dust dynamics for prescribed edge plasma parameters are shown in Figs. 5.17 and
5.18. We notice that a sharp zigzag in the middle of the divertor volume of particle B
in Fig. 5.17 is just a visual effect of the 3D trajectory projected on 2D poloidal
coordinates. Similar effects are also seen in the poloidal projection of dust trajectories in Fig. 5.18. However, the reversal of the toroidal direction of dust propagation
seen in Fig. 5.18 is due to the different directions of the toroidal components of the
plasma flow in the divertor regions of the outer and inner SOL [37]. A similar change
of the toroidal direction of the dust motion was also observed in numerical simulations (e.g. see [68]) and by fast cameras for the case where the dust grain moves from
one divertor to the other (e.g. see Refs [12, 49]).
However, a considerable amount of dust injected into a fusion device can
significantly alter the plasma parameters and even cause termination of the discharge
(recall Fig. 5.1 and see Refs [4, 5]). The numerical simulations performed in Ref.
[78] for two cases of impurity injection into the plasma of (a) neutral atoms and
(b) dust particles have shown a large difference in the edge plasma parameters even
though the rate of impurity mass injection was the same in both cases. However, for
accurate assessment of the dust impact on the edge plasma for the case of a relatively
0.2
1.2
1.4
1.6
1.8
2.0
R, m
Z, m
0.4
0.6
0.8
0.0 0.2 0.4 0.6 0.8 1.0
0.0 0.2 0.4 0.6 0.8 1.0
0.00
0.25
0.50
0.75
1.00
0
Temperature T d , K
C
C
C
1000
2000
3000
4000
A
A
A
B
B
B
D
D
D
L p /L p max
Mass
Fig. 5.17 Left: poloidal projection of 1 μm carbon dust particle trajectories. Dust grains were launched
into DIII-D from outer strike point with velocities 10 (A), 10
2 (B), 10
3 (C), and 10
4 (D) cm/s.
Right: dust grain temperature and relative mass as a function of poloidal distance traveled. (Reproduced
with permission from [78], © AIP Publishing 2005)
106
5 Dust in Fusion Plasmas
is better suitable for the study of dust mobilization from the material surfaces. All of
these codes were developed for dust studies in tokamaks and, therefore, assume the
toroidal symmetry of the plasma parameters. However, the DUSTT code has been
modified recently and is now used for the study of dust dynamics in the helical
device LHD [51]. The plasma parameters used in all of these codes focused on dust
dynamics studies come either from experimental measurements or, in most cases,
from 2D edge plasma transport codes (e.g. see [86]) such as UEDGE [87], different
versions of the SOLPS code (e.g. see [88] and the references therein), and some
others.
A few examples of dust trajectories found from the numerical simulations of the
dust dynamics for prescribed edge plasma parameters are shown in Figs. 5.17 and
5.18. We notice that a sharp zigzag in the middle of the divertor volume of particle B
in Fig. 5.17 is just a visual effect of the 3D trajectory projected on 2D poloidal
coordinates. Similar effects are also seen in the poloidal projection of dust trajectories in Fig. 5.18. However, the reversal of the toroidal direction of dust propagation
seen in Fig. 5.18 is due to the different directions of the toroidal components of the
plasma flow in the divertor regions of the outer and inner SOL [37]. A similar change
of the toroidal direction of the dust motion was also observed in numerical simulations (e.g. see [68]) and by fast cameras for the case where the dust grain moves from
one divertor to the other (e.g. see Refs [12, 49]).
However, a considerable amount of dust injected into a fusion device can
significantly alter the plasma parameters and even cause termination of the discharge
(recall Fig. 5.1 and see Refs [4, 5]). The numerical simulations performed in Ref.
[78] for two cases of impurity injection into the plasma of (a) neutral atoms and
(b) dust particles have shown a large difference in the edge plasma parameters even
though the rate of impurity mass injection was the same in both cases. However, for
accurate assessment of the dust impact on the edge plasma for the case of a relatively
0.2
1.2
1.4
1.6
1.8
2.0
R, m
Z, m
0.4
0.6
0.8
0.0 0.2 0.4 0.6 0.8 1.0
0.0 0.2 0.4 0.6 0.8 1.0
0.00
0.25
0.50
0.75
1.00
0
Temperature T d , K
C
C
C
1000
2000
3000
4000
A
A
A
B
B
B
D
D
D
L p /L p max
Mass
Fig. 5.17 Left: poloidal projection of 1 μm carbon dust particle trajectories. Dust grains were launched
into DIII-D from outer strike point with velocities 10 (A), 10
2 (B), 10
3 (C), and 10
4 (D) cm/s.
Right: dust grain temperature and relative mass as a function of poloidal distance traveled. (Reproduced
with permission from [78], © AIP Publishing 2005)
106
5 Dust in Fusion Plasmas