

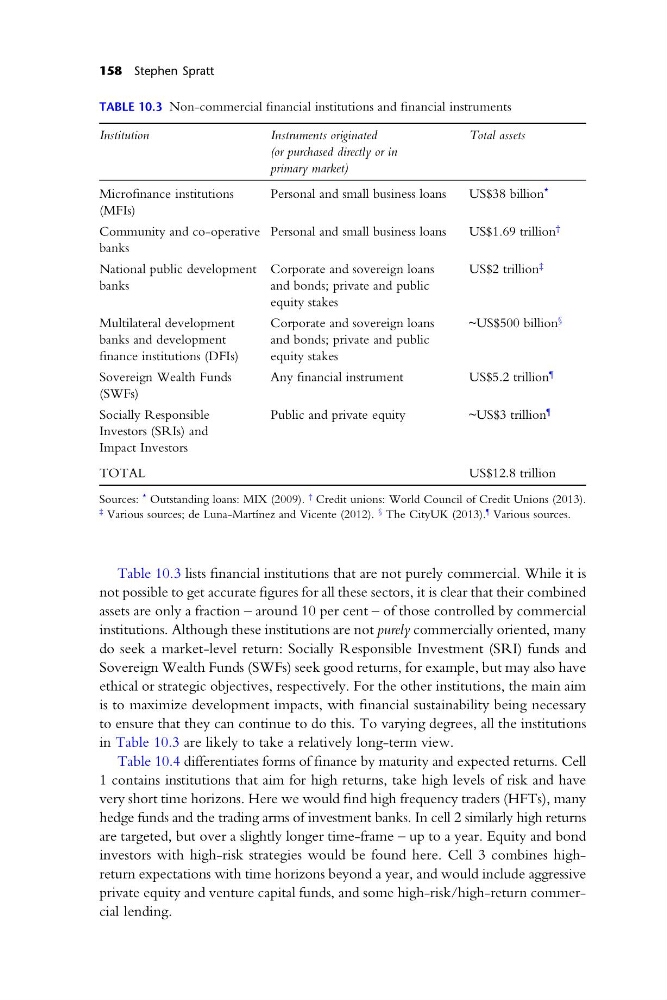
Table 10.3 lists financial institutions that are not purely commercial. While it is
not possible to get accurate figures for all these sectors, it is clear that their combined
assets are only a fraction – around 10 per cent – of those controlled by commercial
institutions. Although these institutions are not purely commercially oriented, many
do seek a market-level return: Socially Responsible Investment (SRI) funds and
Sovereign Wealth Funds (SWFs) seek good returns, for example, but may also have
ethical or strategic objectives, respectively. For the other institutions, the main aim
is to maximize development impacts, with financial sustainability being necessary
to ensure that they can continue to do this. To varying degrees, all the institutions
in Table 10.3 are likely to take a relatively long-term view.
Table 10.4 differentiates forms of finance by maturity and expected returns. Cell
1 contains institutions that aim for high returns, take high levels of risk and have
very short time horizons. Here we would find high frequency traders (HFTs), many
hedge funds and the trading arms of investment banks. In cell 2 similarly high returns
are targeted, but over a slightly longer time-frame – up to a year. Equity and bond
investors with high-risk strategies would be found here. Cell 3 combines highreturn expectations with time horizons beyond a year, and would include aggressive
private equity and venture capital funds, and some high-risk/high-return commer -
cial lending.
158 Stephen Spratt
TABLE 10.3 Non-commercial financial institutions and financial instruments
Institution
Instruments originated
Total assets
(or purchased directly or in
primary market)
Microfinance institutions
Personal and small business loans
US$38 billion
*
(MFIs)
Community and co-operative Personal and small business loans
US$1.69 trillion
†
banks
National public development Corporate and sovereign loans
US$2 trillion
‡
banks
and bonds; private and public
equity stakes
Multilateral development
Corporate and sovereign loans
~US$500 billion
§
banks and development
and bonds; private and public
finance institutions (DFIs)
equity stakes
Sovereign Wealth Funds
Any financial instrument
US$5.2 trillion
¶
(SWFs)
Socially Responsible
Public and private equity
~US$3 trillion
¶
Investors (SRIs) and
Impact Investors
TOTAL
US$12.8 trillion
Sources:
* Outstanding loans: MIX (2009).
† Credit unions: World Council of Credit Unions (2013).
‡ Various sources; de Luna-Martínez and Vicente (2012).
§ The CityUK (2013).
¶ Various sources.
not possible to get accurate figures for all these sectors, it is clear that their combined
assets are only a fraction – around 10 per cent – of those controlled by commercial
institutions. Although these institutions are not purely commercially oriented, many
do seek a market-level return: Socially Responsible Investment (SRI) funds and
Sovereign Wealth Funds (SWFs) seek good returns, for example, but may also have
ethical or strategic objectives, respectively. For the other institutions, the main aim
is to maximize development impacts, with financial sustainability being necessary
to ensure that they can continue to do this. To varying degrees, all the institutions
in Table 10.3 are likely to take a relatively long-term view.
Table 10.4 differentiates forms of finance by maturity and expected returns. Cell
1 contains institutions that aim for high returns, take high levels of risk and have
very short time horizons. Here we would find high frequency traders (HFTs), many
hedge funds and the trading arms of investment banks. In cell 2 similarly high returns
are targeted, but over a slightly longer time-frame – up to a year. Equity and bond
investors with high-risk strategies would be found here. Cell 3 combines highreturn expectations with time horizons beyond a year, and would include aggressive
private equity and venture capital funds, and some high-risk/high-return commer -
cial lending.
158 Stephen Spratt
TABLE 10.3 Non-commercial financial institutions and financial instruments
Institution
Instruments originated
Total assets
(or purchased directly or in
primary market)
Microfinance institutions
Personal and small business loans
US$38 billion
*
(MFIs)
Community and co-operative Personal and small business loans
US$1.69 trillion
†
banks
National public development Corporate and sovereign loans
US$2 trillion
‡
banks
and bonds; private and public
equity stakes
Multilateral development
Corporate and sovereign loans
~US$500 billion
§
banks and development
and bonds; private and public
finance institutions (DFIs)
equity stakes
Sovereign Wealth Funds
Any financial instrument
US$5.2 trillion
¶
(SWFs)
Socially Responsible
Public and private equity
~US$3 trillion
¶
Investors (SRIs) and
Impact Investors
TOTAL
US$12.8 trillion
Sources:
* Outstanding loans: MIX (2009).
† Credit unions: World Council of Credit Unions (2013).
‡ Various sources; de Luna-Martínez and Vicente (2012).
§ The CityUK (2013).
¶ Various sources.