

2.6 Colour
21
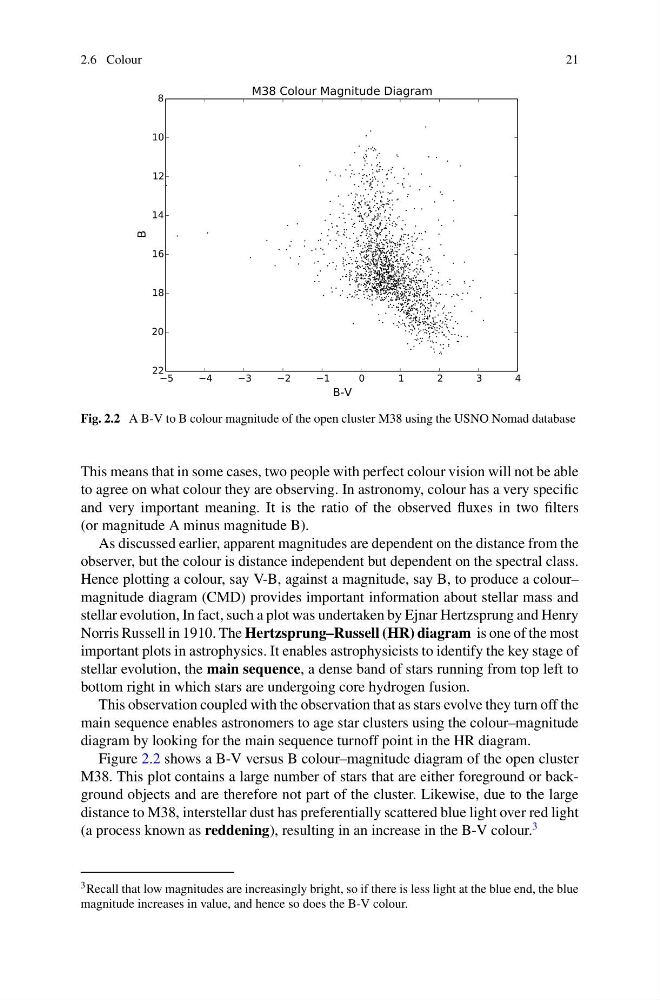
Fig. 2.2 A B-V to B colour magnitude of the open cluster M38 using the USNO Nomad database
This means that in some cases, two people with perfect colour vision will not be able
to agree on what colour they are observing. In astronomy, colour has a very specific
and very important meaning. It is the ratio of the observed fluxes in two filters
(or magnitude A minus magnitude B).
As discussed earlier, apparent magnitudes are dependent on the distance from the
observer, but the colour is distance independent but dependent on the spectral class.
Hence plotting a colour, say V-B, against a magnitude, say B, to produce a colour–
magnitude diagram (CMD) provides important information about stellar mass and
stellar evolution, In fact, such a plot was undertaken by Ejnar Hertzsprung and Henry
Norris Russell in 1910. The Hertzsprung–Russell (HR) diagram is one of the most
important plots in astrophysics. It enables astrophysicists to identify the key stage of
stellar evolution, the main sequence, a dense band of stars running from top left to
bottom right in which stars are undergoing core hydrogen fusion.
This observation coupled with the observation that as stars evolve they turn off the
main sequence enables astronomers to age star clusters using the colour–magnitude
diagram by looking for the main sequence turnoff point in the HR diagram.
Figure 2.2 shows a B-V versus B colour–magnitude diagram of the open cluster
M38. This plot contains a large number of stars that are either foreground or background objects and are therefore not part of the cluster. Likewise, due to the large
distance to M38, interstellar dust has preferentially scattered blue light over red light
(a process known as reddening), resulting in an increase in the B-V colour.
3
3 Recall that low magnitudes are increasingly bright, so if there is less light at the blue end, the blue
magnitude increases in value, and hence so does the B-V colour.
21
Fig. 2.2 A B-V to B colour magnitude of the open cluster M38 using the USNO Nomad database
This means that in some cases, two people with perfect colour vision will not be able
to agree on what colour they are observing. In astronomy, colour has a very specific
and very important meaning. It is the ratio of the observed fluxes in two filters
(or magnitude A minus magnitude B).
As discussed earlier, apparent magnitudes are dependent on the distance from the
observer, but the colour is distance independent but dependent on the spectral class.
Hence plotting a colour, say V-B, against a magnitude, say B, to produce a colour–
magnitude diagram (CMD) provides important information about stellar mass and
stellar evolution, In fact, such a plot was undertaken by Ejnar Hertzsprung and Henry
Norris Russell in 1910. The Hertzsprung–Russell (HR) diagram is one of the most
important plots in astrophysics. It enables astrophysicists to identify the key stage of
stellar evolution, the main sequence, a dense band of stars running from top left to
bottom right in which stars are undergoing core hydrogen fusion.
This observation coupled with the observation that as stars evolve they turn off the
main sequence enables astronomers to age star clusters using the colour–magnitude
diagram by looking for the main sequence turnoff point in the HR diagram.
Figure 2.2 shows a B-V versus B colour–magnitude diagram of the open cluster
M38. This plot contains a large number of stars that are either foreground or background objects and are therefore not part of the cluster. Likewise, due to the large
distance to M38, interstellar dust has preferentially scattered blue light over red light
(a process known as reddening), resulting in an increase in the B-V colour.
3
3 Recall that low magnitudes are increasingly bright, so if there is less light at the blue end, the blue
magnitude increases in value, and hence so does the B-V colour.