

140
9 Image Reduction and Processing
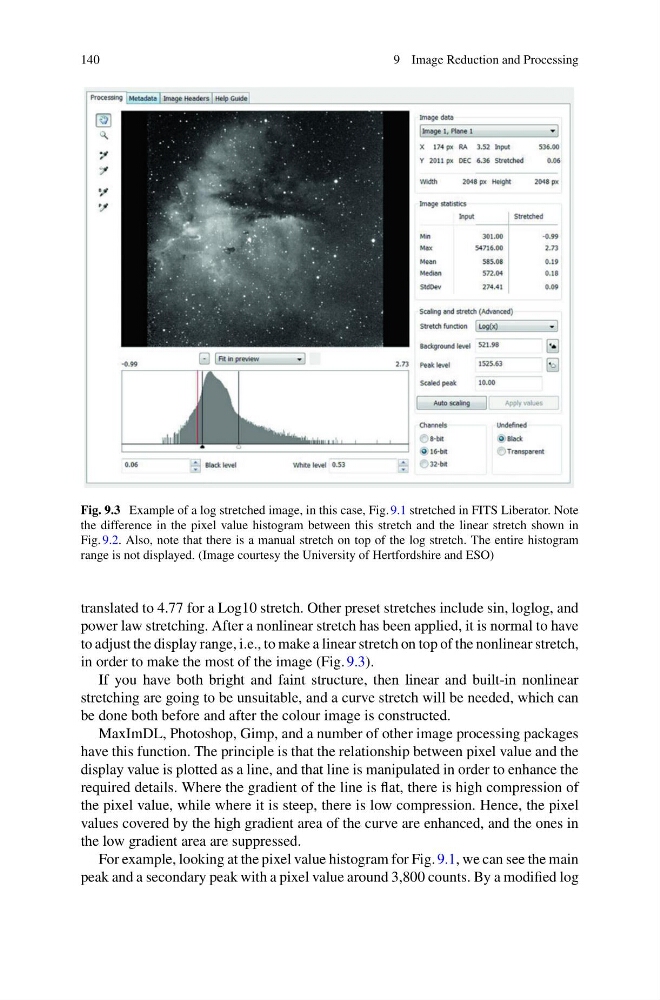
Fig. 9.3 Example of a log stretched image, in this case, Fig. 9.1 stretched in FITS Liberator. Note
the difference in the pixel value histogram between this stretch and the linear stretch shown in
Fig. 9.2. Also, note that there is a manual stretch on top of the log stretch. The entire histogram
range is not displayed. (Image courtesy the University of Hertfordshire and ESO)
translated to 4.77 for a Log10 stretch. Other preset stretches include sin, loglog, and
power law stretching. After a nonlinear stretch has been applied, it is normal to have
to adjust the display range, i.e., to make a linear stretch on top of the nonlinear stretch,
in order to make the most of the image (Fig. 9.3).
If you have both bright and faint structure, then linear and built-in nonlinear
stretching are going to be unsuitable, and a curve stretch will be needed, which can
be done both before and after the colour image is constructed.
MaxImDL, Photoshop, Gimp, and a number of other image processing packages
have this function. The principle is that the relationship between pixel value and the
display value is plotted as a line, and that line is manipulated in order to enhance the
required details. Where the gradient of the line is flat, there is high compression of
the pixel value, while where it is steep, there is low compression. Hence, the pixel
values covered by the high gradient area of the curve are enhanced, and the ones in
the low gradient area are suppressed.
For example, looking at the pixel value histogram for Fig. 9.1, we can see the main
peak and a secondary peak with a pixel value around 3,800 counts. By a modified log
9 Image Reduction and Processing
Fig. 9.3 Example of a log stretched image, in this case, Fig. 9.1 stretched in FITS Liberator. Note
the difference in the pixel value histogram between this stretch and the linear stretch shown in
Fig. 9.2. Also, note that there is a manual stretch on top of the log stretch. The entire histogram
range is not displayed. (Image courtesy the University of Hertfordshire and ESO)
translated to 4.77 for a Log10 stretch. Other preset stretches include sin, loglog, and
power law stretching. After a nonlinear stretch has been applied, it is normal to have
to adjust the display range, i.e., to make a linear stretch on top of the nonlinear stretch,
in order to make the most of the image (Fig. 9.3).
If you have both bright and faint structure, then linear and built-in nonlinear
stretching are going to be unsuitable, and a curve stretch will be needed, which can
be done both before and after the colour image is constructed.
MaxImDL, Photoshop, Gimp, and a number of other image processing packages
have this function. The principle is that the relationship between pixel value and the
display value is plotted as a line, and that line is manipulated in order to enhance the
required details. Where the gradient of the line is flat, there is high compression of
the pixel value, while where it is steep, there is low compression. Hence, the pixel
values covered by the high gradient area of the curve are enhanced, and the ones in
the low gradient area are suppressed.
For example, looking at the pixel value histogram for Fig. 9.1, we can see the main
peak and a secondary peak with a pixel value around 3,800 counts. By a modified log