

9.2 Stretching the Curve
141
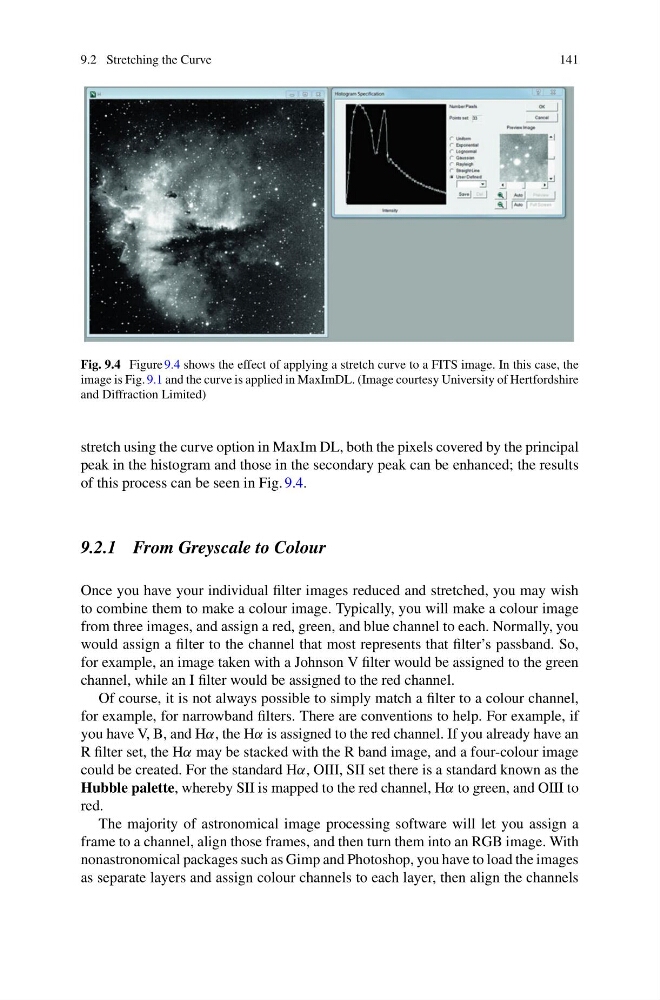
Fig. 9.4 Figure 9.4 shows the effect of applying a stretch curve to a FITS image. In this case, the
image is Fig. 9.1 and the curve is applied in MaxImDL. (Image courtesy University of Hertfordshire
and Diffraction Limited)
stretch using the curve option in MaxIm DL, both the pixels covered by the principal
peak in the histogram and those in the secondary peak can be enhanced; the results
of this process can be seen in Fig. 9.4.
9.2.1 From Greyscale to Colour
Once you have your individual filter images reduced and stretched, you may wish
to combine them to make a colour image. Typically, you will make a colour image
from three images, and assign a red, green, and blue channel to each. Normally, you
would assign a filter to the channel that most represents that filter’s passband. So,
for example, an image taken with a Johnson V filter would be assigned to the green
channel, while an I filter would be assigned to the red channel.
Of course, it is not always possible to simply match a filter to a colour channel,
for example, for narrowband filters. There are conventions to help. For example, if
you have V, B, and Hα, the Hα is assigned to the red channel. If you already have an
R filter set, the Hα may be stacked with the R band image, and a four-colour image
could be created. For the standard Hα, OIII, SII set there is a standard known as the
Hubble palette, whereby SII is mapped to the red channel, Hα to green, and OIII to
red.
The majority of astronomical image processing software will let you assign a
frame to a channel, align those frames, and then turn them into an RGB image. With
nonastronomical packages such as Gimp and Photoshop, you have to load the images
as separate layers and assign colour channels to each layer, then align the channels
141
Fig. 9.4 Figure 9.4 shows the effect of applying a stretch curve to a FITS image. In this case, the
image is Fig. 9.1 and the curve is applied in MaxImDL. (Image courtesy University of Hertfordshire
and Diffraction Limited)
stretch using the curve option in MaxIm DL, both the pixels covered by the principal
peak in the histogram and those in the secondary peak can be enhanced; the results
of this process can be seen in Fig. 9.4.
9.2.1 From Greyscale to Colour
Once you have your individual filter images reduced and stretched, you may wish
to combine them to make a colour image. Typically, you will make a colour image
from three images, and assign a red, green, and blue channel to each. Normally, you
would assign a filter to the channel that most represents that filter’s passband. So,
for example, an image taken with a Johnson V filter would be assigned to the green
channel, while an I filter would be assigned to the red channel.
Of course, it is not always possible to simply match a filter to a colour channel,
for example, for narrowband filters. There are conventions to help. For example, if
you have V, B, and Hα, the Hα is assigned to the red channel. If you already have an
R filter set, the Hα may be stacked with the R band image, and a four-colour image
could be created. For the standard Hα, OIII, SII set there is a standard known as the
Hubble palette, whereby SII is mapped to the red channel, Hα to green, and OIII to
red.
The majority of astronomical image processing software will let you assign a
frame to a channel, align those frames, and then turn them into an RGB image. With
nonastronomical packages such as Gimp and Photoshop, you have to load the images
as separate layers and assign colour channels to each layer, then align the channels