

13.3 Correction and Monitoring of Wind Tunnel Results by CFD
277
13.3 Correction and Monitoring of Wind Tunnel Results
by CFD
Initial calculation allows for correction of the effects resulting from wind tunnel walls
and the model support which affect loads measurement and the pressure distribution
on the model. The blockage effect can be accounted for and the Reynolds number,
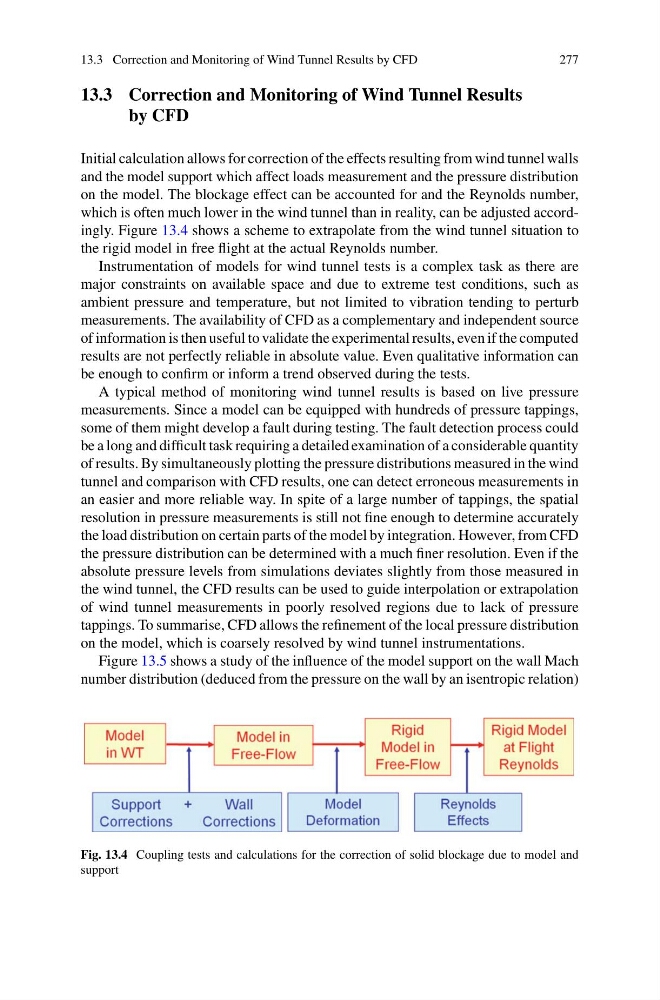
which is often much lower in the wind tunnel than in reality, can be adjusted accordingly. Figure 13.4 shows a scheme to extrapolate from the wind tunnel situation to
the rigid model in free flight at the actual Reynolds number.
Instrumentation of models for wind tunnel tests is a complex task as there are
major constraints on available space and due to extreme test conditions, such as
ambient pressure and temperature, but not limited to vibration tending to perturb
measurements. The availability of CFD as a complementary and independent source
of information is then useful to validate the experimental results, even if the computed
results are not perfectly reliable in absolute value. Even qualitative information can
be enough to confirm or inform a trend observed during the tests.
A typical method of monitoring wind tunnel results is based on live pressure
measurements. Since a model can be equipped with hundreds of pressure tappings,
some of them might develop a fault during testing. The fault detection process could
be a long and difficult task requiring a detailed examination of a considerable quantity
of results. By simultaneously plotting the pressure distributions measured in the wind
tunnel and comparison with CFD results, one can detect erroneous measurements in
an easier and more reliable way. In spite of a large number of tappings, the spatial
resolution in pressure measurements is still not fine enough to determine accurately
the load distribution on certain parts of the model by integration. However, from CFD
the pressure distribution can be determined with a much finer resolution. Even if the
absolute pressure levels from simulations deviates slightly from those measured in
the wind tunnel, the CFD results can be used to guide interpolation or extrapolation
of wind tunnel measurements in poorly resolved regions due to lack of pressure
tappings. To summarise, CFD allows the refinement of the local pressure distribution
on the model, which is coarsely resolved by wind tunnel instrumentations.
Figure 13.5 shows a study of the influence of the model support on the wall Mach
number distribution (deduced from the pressure on the wall by an isentropic relation)
Fig. 13.4 Coupling tests and calculations for the correction of solid blockage due to model and
support
277
13.3 Correction and Monitoring of Wind Tunnel Results
by CFD
Initial calculation allows for correction of the effects resulting from wind tunnel walls
and the model support which affect loads measurement and the pressure distribution
on the model. The blockage effect can be accounted for and the Reynolds number,
which is often much lower in the wind tunnel than in reality, can be adjusted accordingly. Figure 13.4 shows a scheme to extrapolate from the wind tunnel situation to
the rigid model in free flight at the actual Reynolds number.
Instrumentation of models for wind tunnel tests is a complex task as there are
major constraints on available space and due to extreme test conditions, such as
ambient pressure and temperature, but not limited to vibration tending to perturb
measurements. The availability of CFD as a complementary and independent source
of information is then useful to validate the experimental results, even if the computed
results are not perfectly reliable in absolute value. Even qualitative information can
be enough to confirm or inform a trend observed during the tests.
A typical method of monitoring wind tunnel results is based on live pressure
measurements. Since a model can be equipped with hundreds of pressure tappings,
some of them might develop a fault during testing. The fault detection process could
be a long and difficult task requiring a detailed examination of a considerable quantity
of results. By simultaneously plotting the pressure distributions measured in the wind
tunnel and comparison with CFD results, one can detect erroneous measurements in
an easier and more reliable way. In spite of a large number of tappings, the spatial
resolution in pressure measurements is still not fine enough to determine accurately
the load distribution on certain parts of the model by integration. However, from CFD
the pressure distribution can be determined with a much finer resolution. Even if the
absolute pressure levels from simulations deviates slightly from those measured in
the wind tunnel, the CFD results can be used to guide interpolation or extrapolation
of wind tunnel measurements in poorly resolved regions due to lack of pressure
tappings. To summarise, CFD allows the refinement of the local pressure distribution
on the model, which is coarsely resolved by wind tunnel instrumentations.
Figure 13.5 shows a study of the influence of the model support on the wall Mach
number distribution (deduced from the pressure on the wall by an isentropic relation)
Fig. 13.4 Coupling tests and calculations for the correction of solid blockage due to model and
support